Slides you'll
want
to show off.
So good, you'll regret signing that NDA.
Scroll
Make it look effortless.
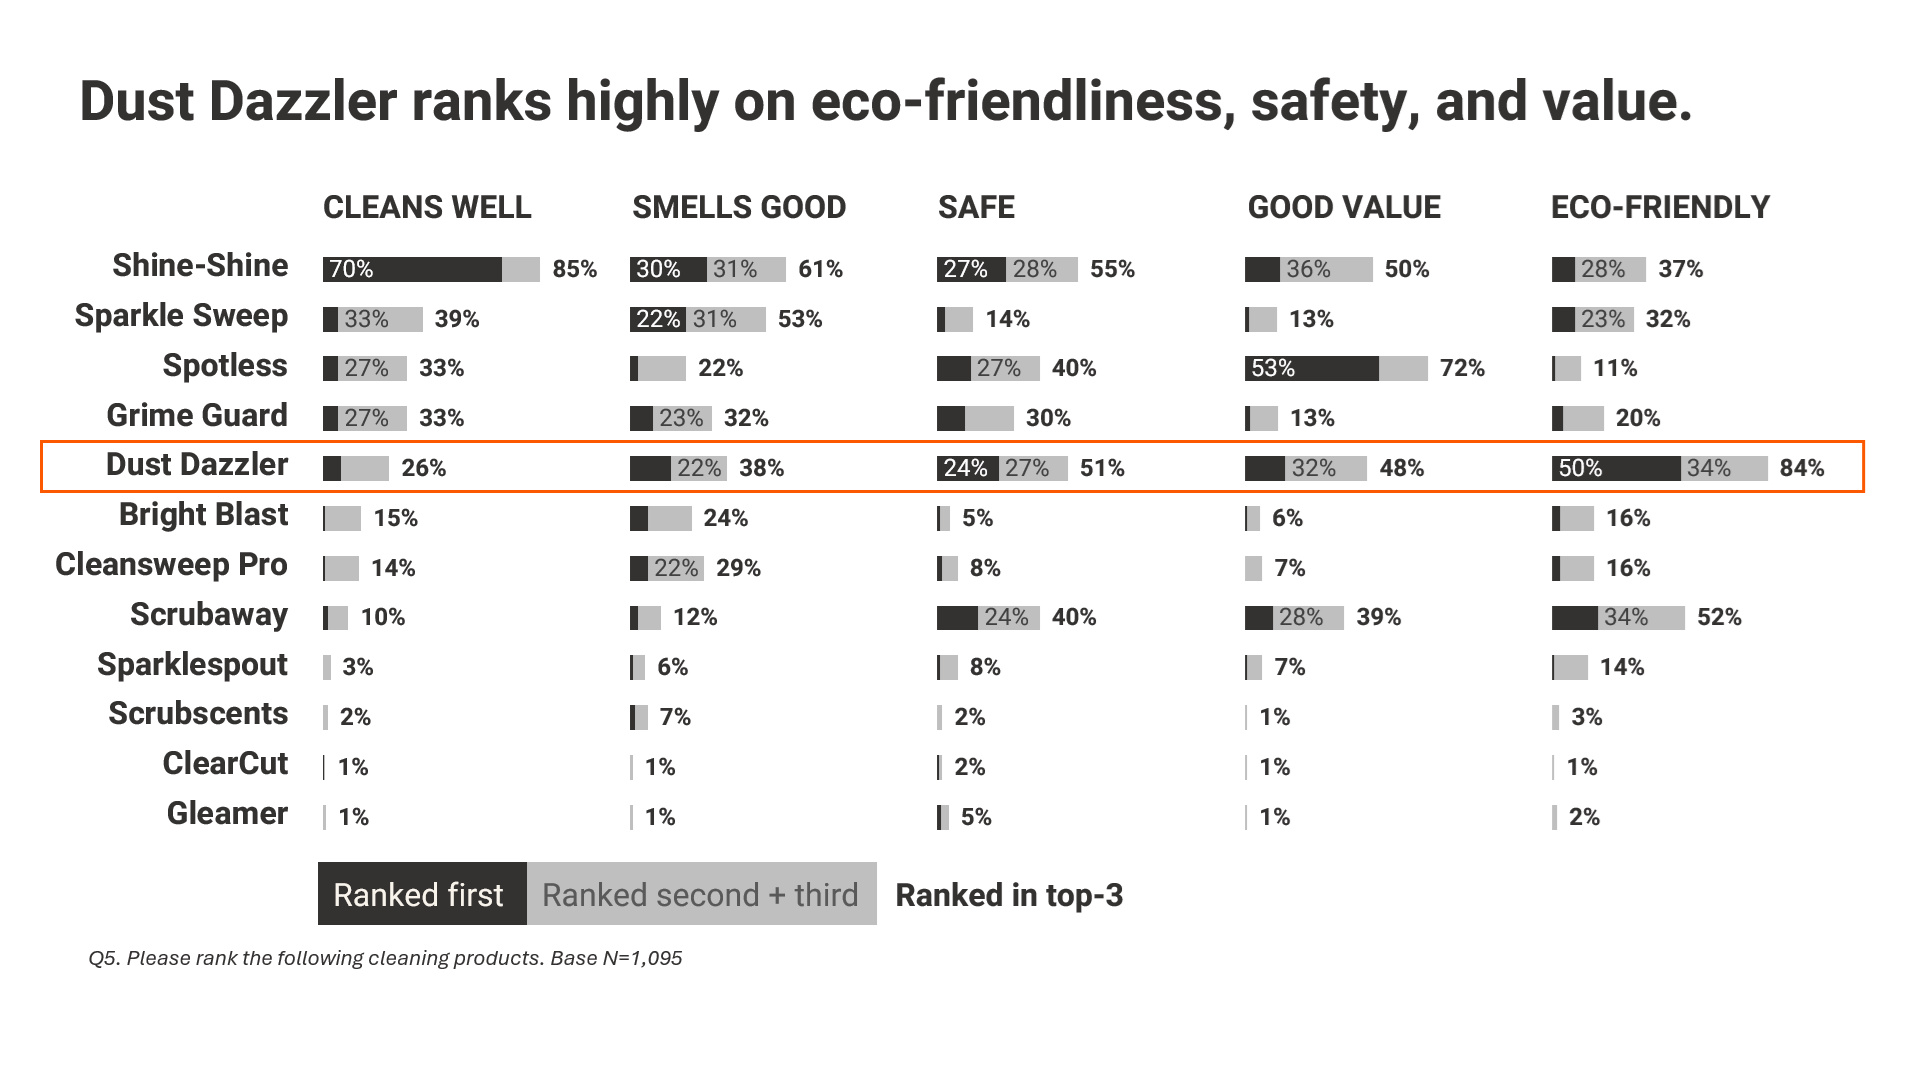
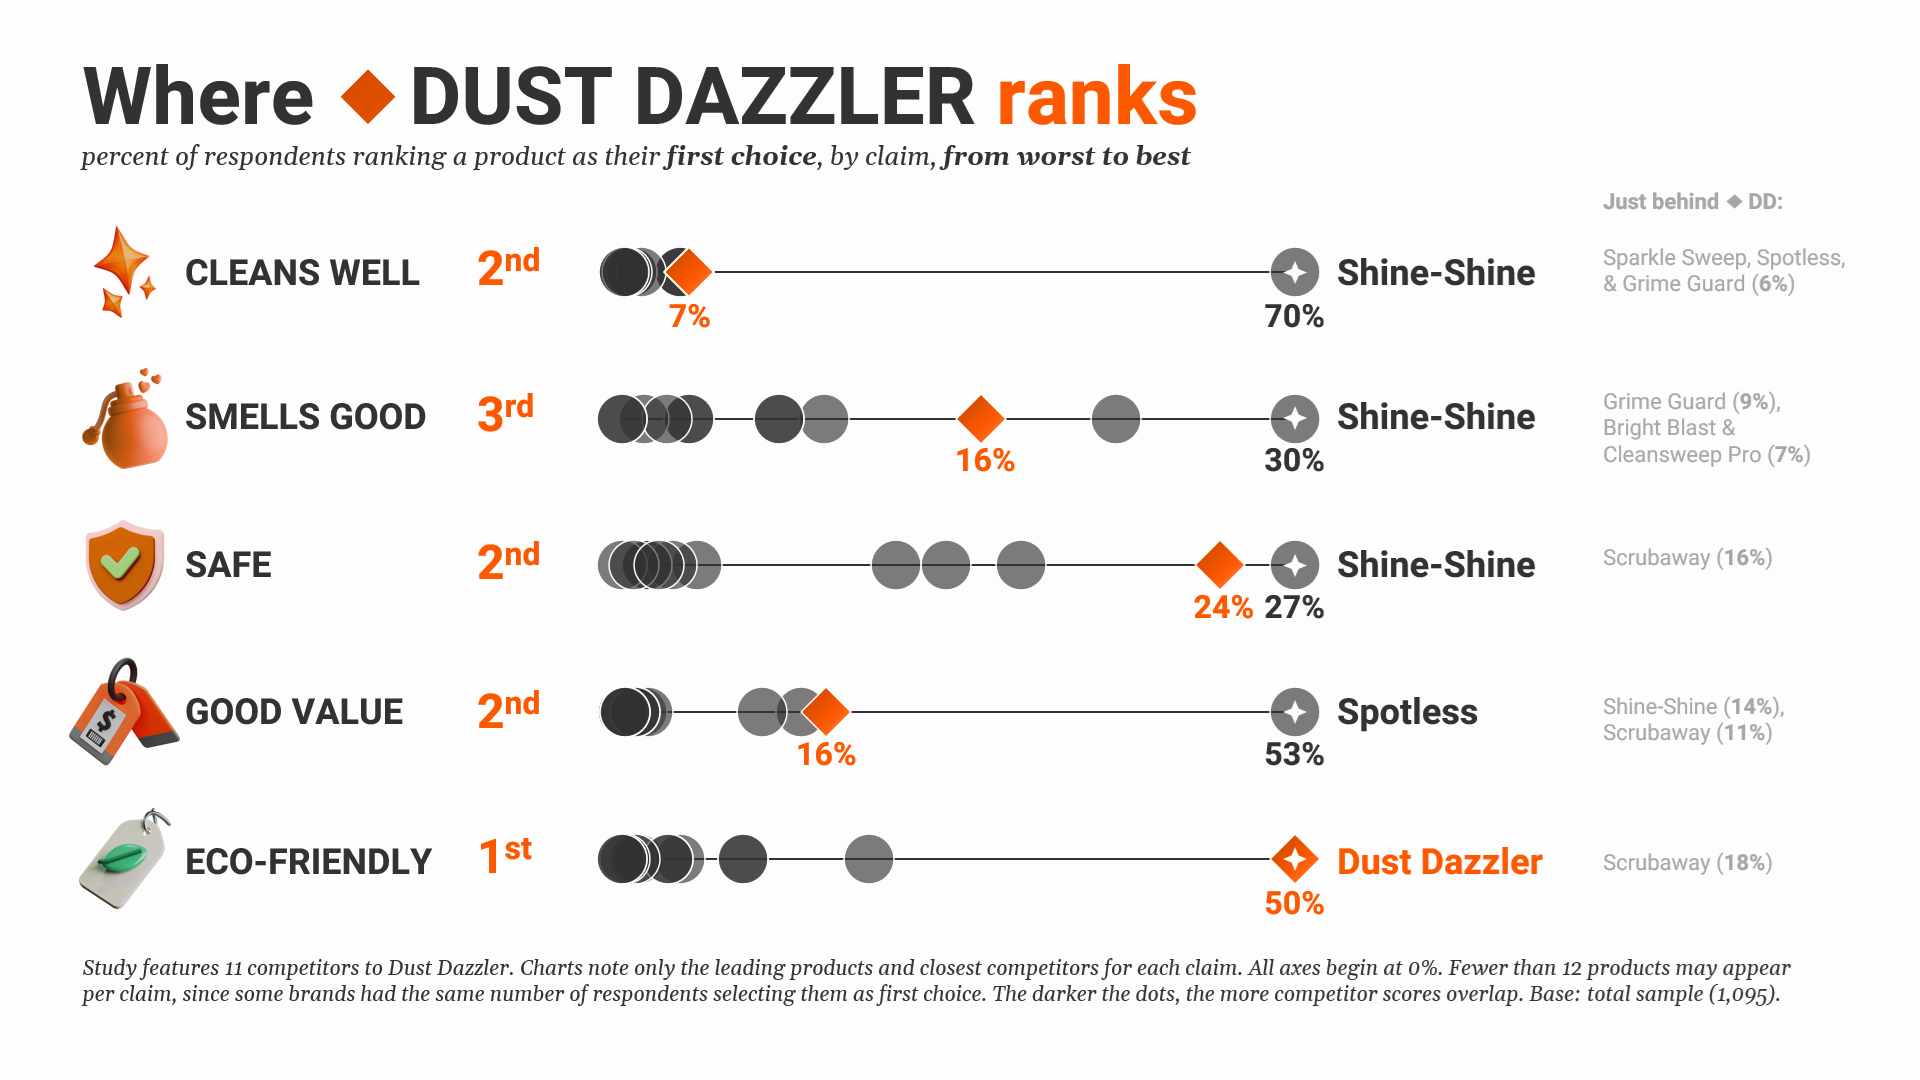
All examples show mock data.
Get straight to the point.
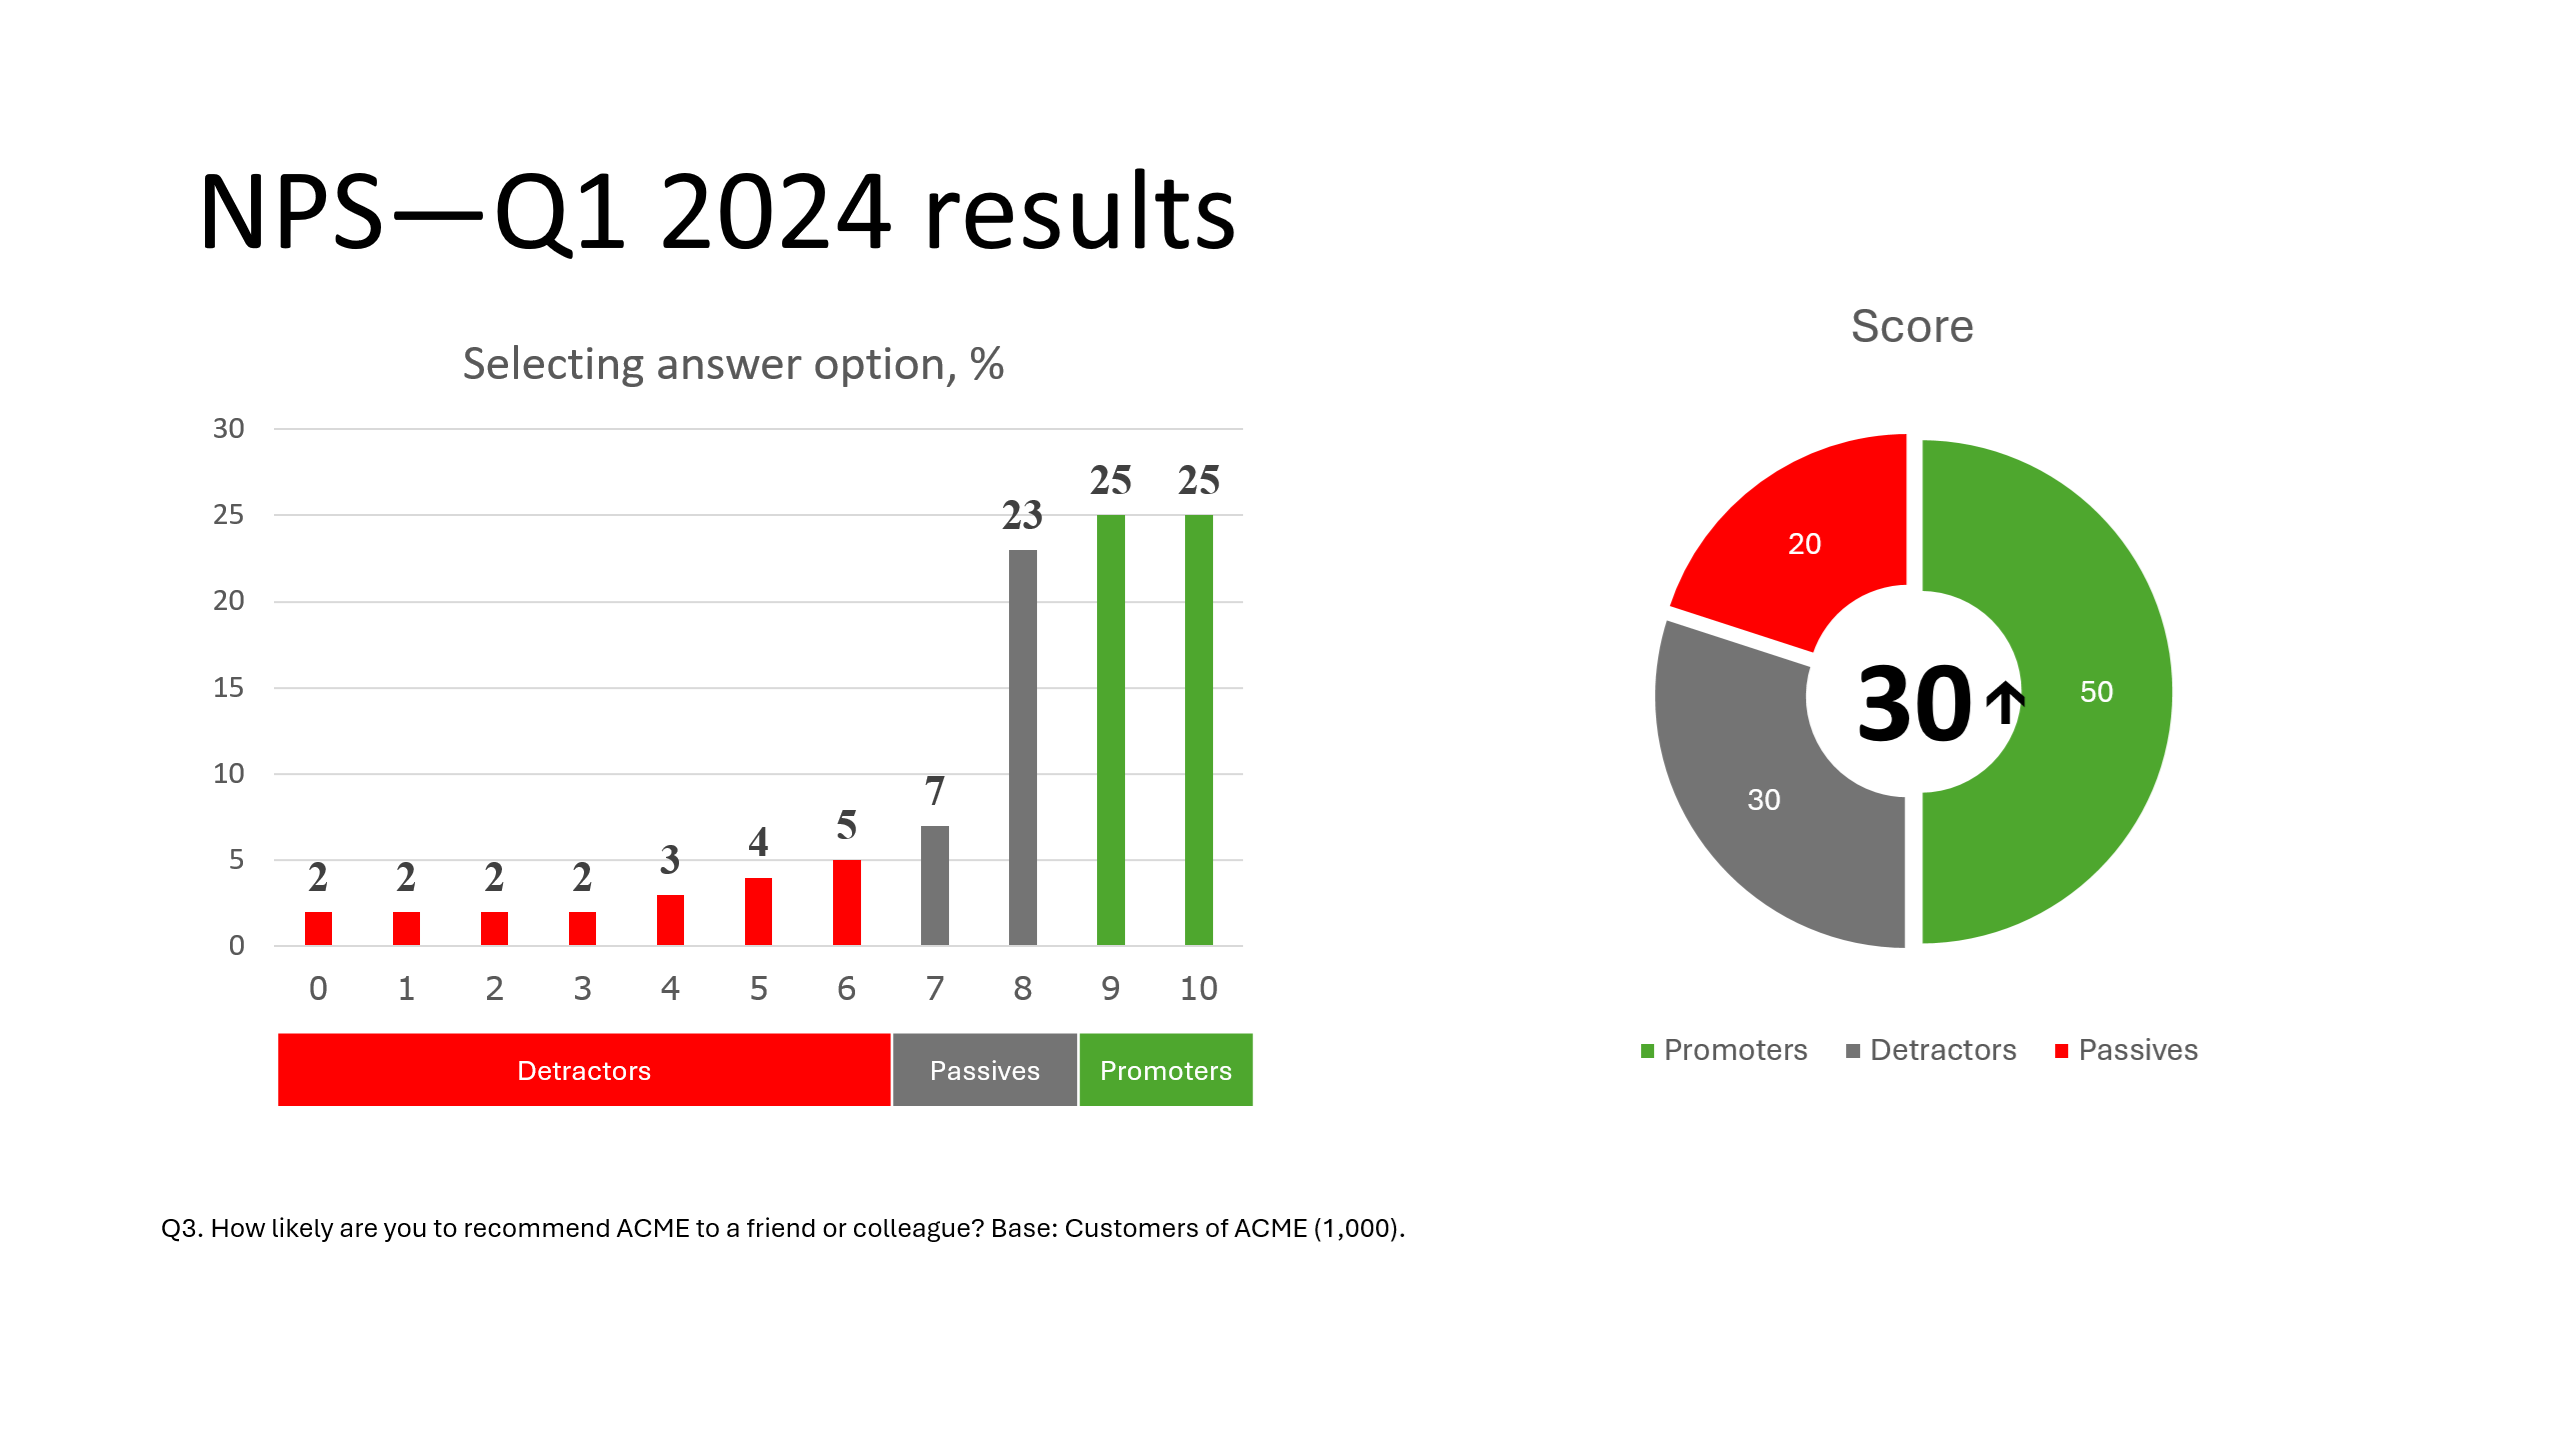
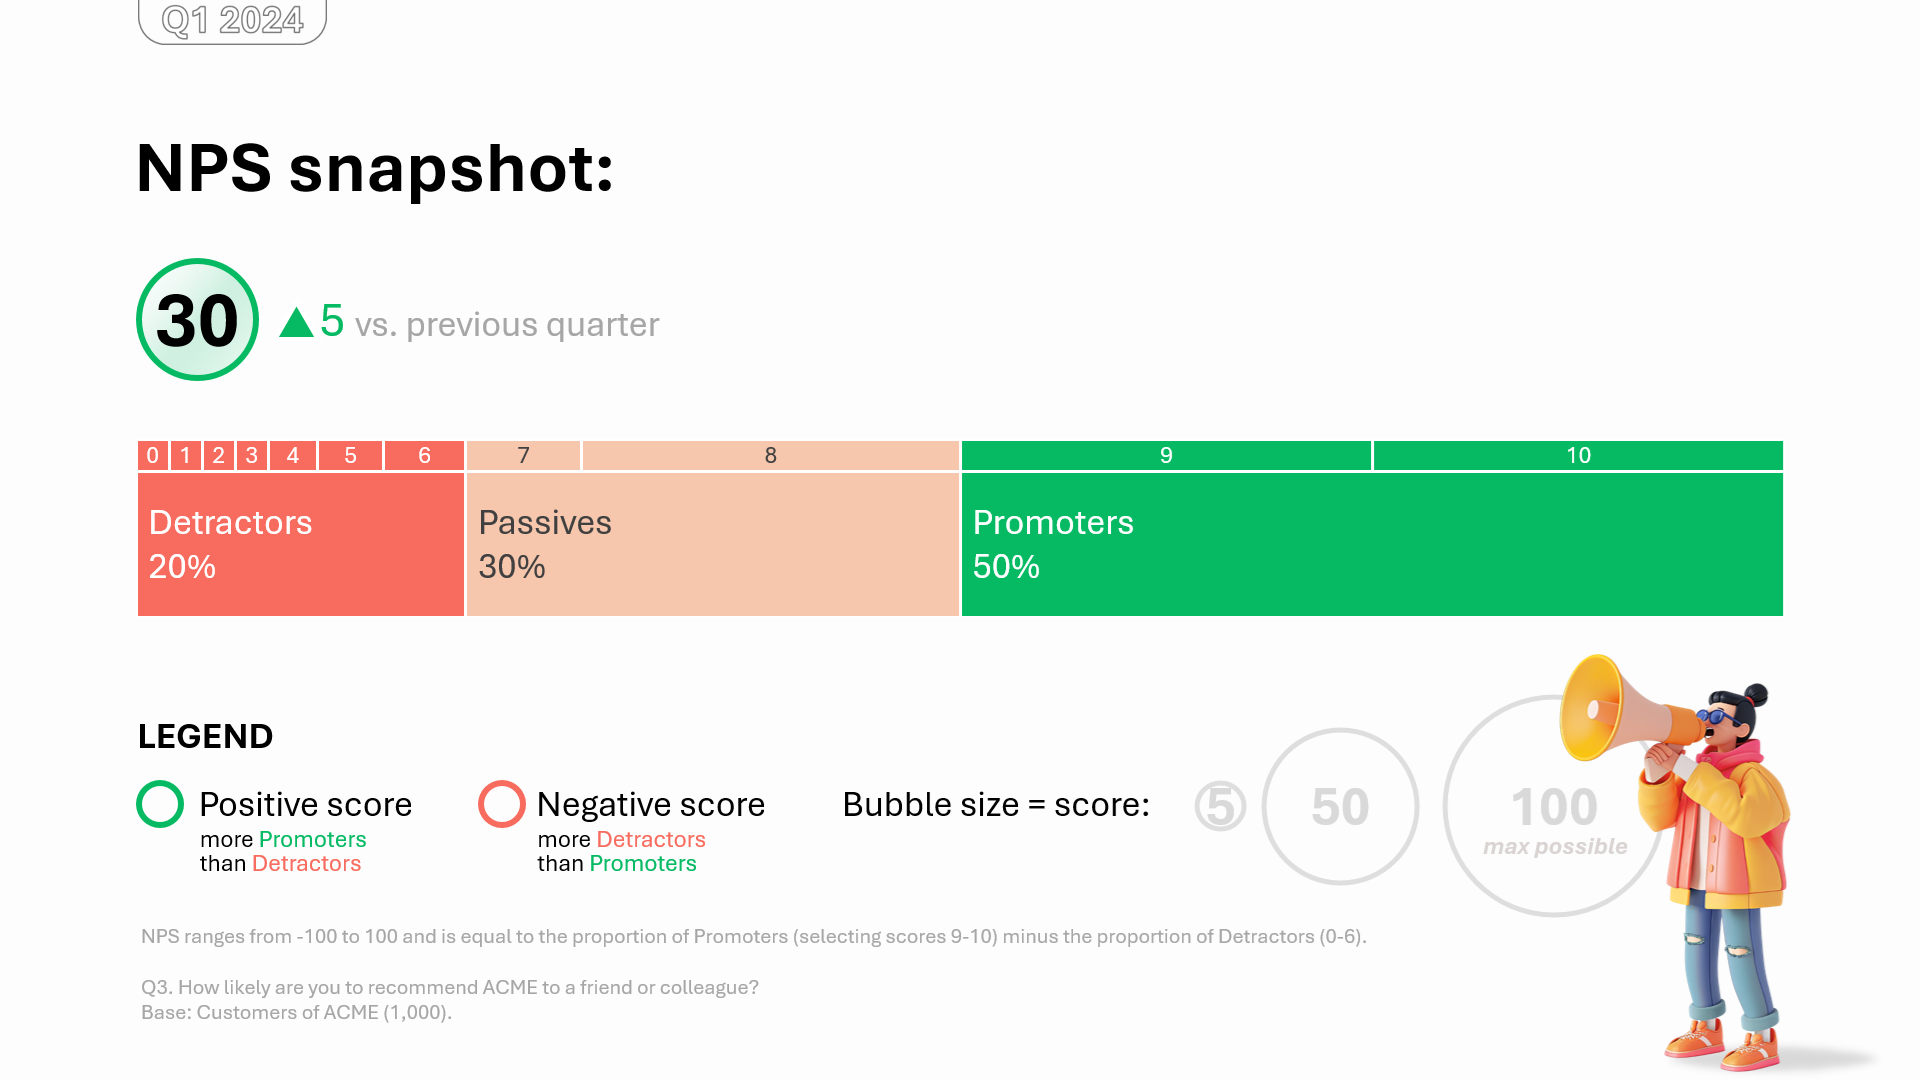
Give an old report a face-lift.

I am your
premium reporting
partner
for custom
survey-based
research.
I am an analyst with MRx full-service agency experience, turned data visualization specialist.
I worked on hundreds of reports for private & public sector clients, including several Fortune 500 corporations.
I obsess over creating efficient, pixel-perfect charts and slides that don’t compromise on rigor to communicate survey results with impact.
I share my knowledge with hundreds of supplier- and client-side insights folks globally in my LinkedIn posts.
What is your goal?
How I help
What I work with
Best project fit
How I help
What I work with
Best project fit
How I help
What I work with
Best project fit
Elevate your reporting
Fancy—
without the
fancy tools.
No committing to third party subscription software, uploading your respondent data to a cloud, or having to learn to code. And certainly no need to allocate your team's time to learning a new process. I deliver static PowerPoint decks with “native” Excel charts you and your clients are used to opening and editing.
Insights
first, charts second.
In many market research firms, decks are designed bottom-up: analysts design, and consultants add comments after the fact. Instead, I model my process after the top management consulting firms, where slide design is top-down, originating from the consultants. This ensures a coherent, story-driven vision.
Personalized
attention
to detail.
Think less “analyst,” more “partner.” At all times, I pour over every detail of your reporting and provide best-practice advice. And if you need your results written up, this can be part of the package, as well.
Supplier or client,
I meet you where you are.

Custom
PowerPoint
report
Cookie-cutter charts = cookie-cutter impact. Your research deserves bespoke, not fast fashion: an expertly laid out report with charting choices that are the best fit for your data story and your client.
Starting at 2,500 USD per project.

Reports,
automated
for replication
Machine efficiency without losing the bespoke flair. When you need to scale up and replicate (tracking, multi-country, siloed departments). No reporting task is too daunting for bespoke automation.
Starting at 8,000 USD per project.

à la carte:
One or a few slides only
Wow your client with a “money slide” intro to the rest of your report, or connect the disjointed slides from your insight repository. To work with me, you don’t need to have a full report to make. Order as much as you need.
Starting at 300 USD per slide.

See how I helped
my client free up
time for insights with
automated reporting
on a multi-country study.

Need something
extra fancy?
The pressure is on: insight shelf life is shorter than a season in fast fashion. Make your insights stick with activation content designed for where your clients are: social media, newsletters, animated video, infographics—desktop- or mobile-first.
How this works
Flip the cards to learn more.
Talk.
Tell me about your and your end client’s needs for the project.
Screenshare your draft or previously delivered report(s). I assess, confirm availability, and send you a quote shortly after the call.
This is a free call. If you email me your standard NDA, I will sign it before our meeting.
Shake hands.
If you’d like to proceed, I accept half of the fee upfront and write up a SOW for your review.
Measure.
It’s all about finding the right fit. We dial in the storyboarding, design choices, palettes, layouts, optimal chart types, and the technical stuff—like stat-testing indicators.
Stitch.
Time to dress your numbers to the nines.
After you send me the aggregated data in an Excel-friendly format, I stitch it together.
Admire.
In a bit, you receive your impactful slides, perfectly laid out and charted, and ready for your big presentation.
You can’t believe how good this makes you look.
Deliver what your
buyers already expect.
According to the 2022 GRIT Insights Practice report:
Expectations
Over nine in ten buyers
expect suppliers to do
data visualization & storytelling...
Reality
..but just one in three
are completely/very satisfied
with supplier performance.
Step into the atelier.
Bespoke reporting services
Market research reports in PowerPoint
Reports automated for quick replication
Activation & marketing
Bespoke Research Solutions Inc., 2024 | Privacy policy
