Reach your clients where they are
Looking to promote a self-sponsored study? Don’t just hide your full report behind an email sign-up wall.
Keep things effortless for your prospects: get in their social feeds. Leverage the organic reach of your company’s LinkedIn page and the personal profiles of your consultants and business development leaders.
Showcase your most intriguing results—post an engaging carousel. (Carousels get 5X the average LinkedIn CTR—even on business pages, according to a 2022-2023 Social Insider study of >100K posts from >1K business pages.)
Satisfy a prospect’s curiosity, no-holds-barred, while also teasing your reporting capabilities in a quick, hands-on demo.
A tiny square.
Packed with insight.
Point out what's important.
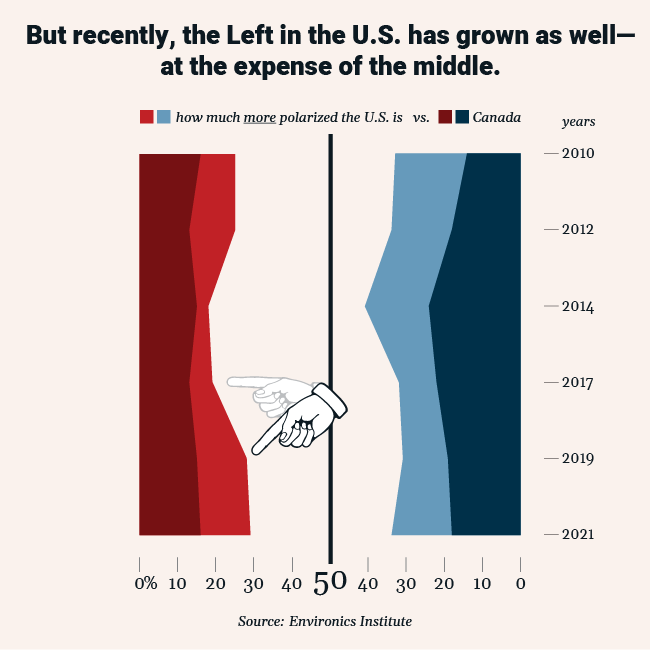
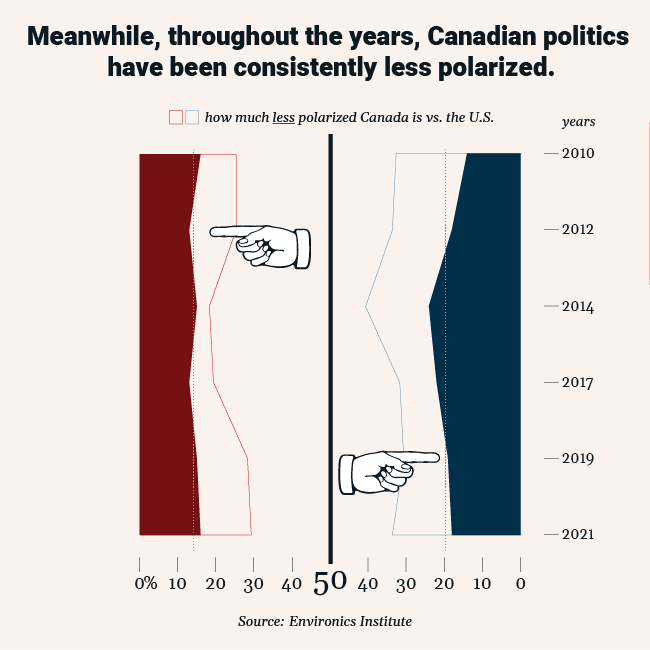
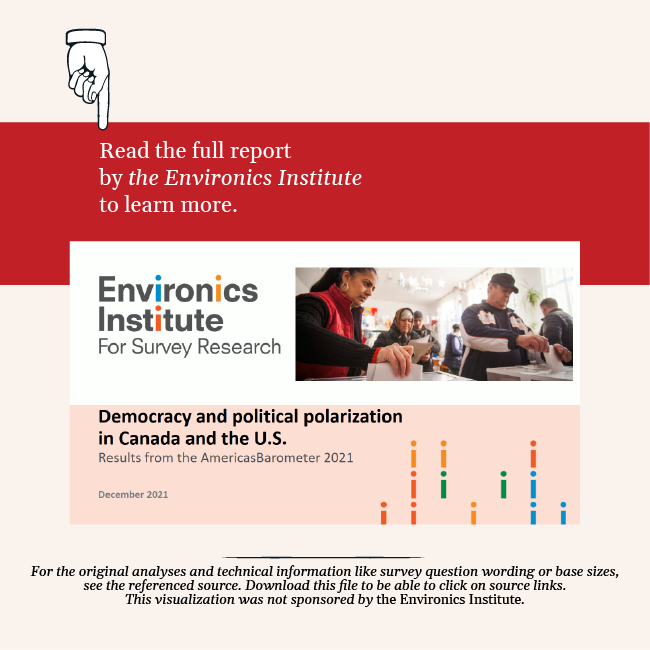
Designed as a mini-report, this social media post explores the evolution of the political spectrum in Canada and the U.S. over a decade—all in just one area chart. Throughout, pointers indicate where the reader should focus their attention. The CTA at the end encourages the viewer to see the full report.
Data source: AmericasBarometer survey by the Environics Institute
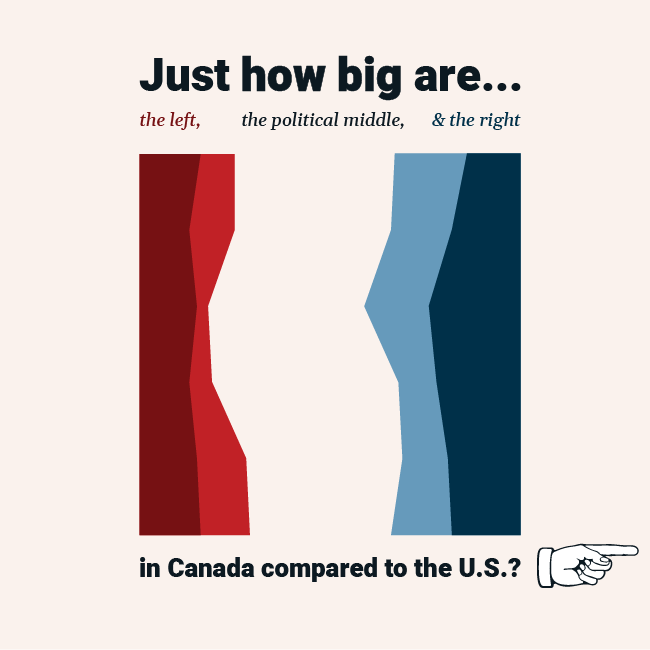
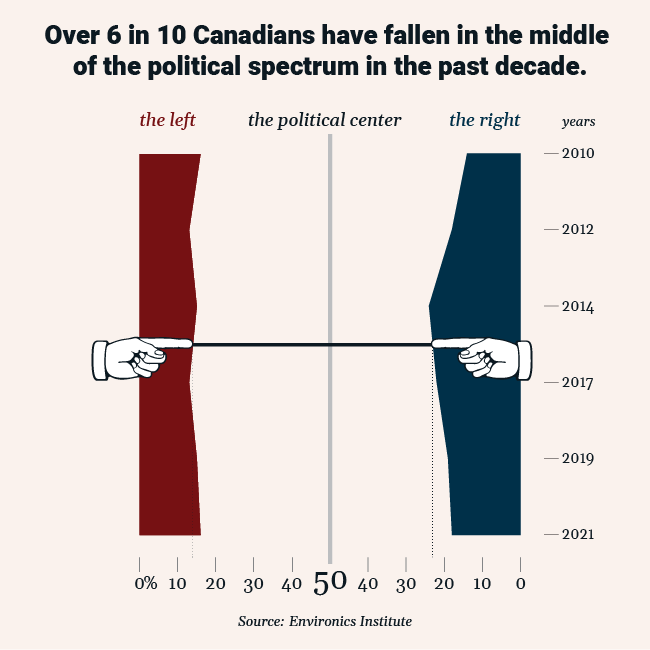
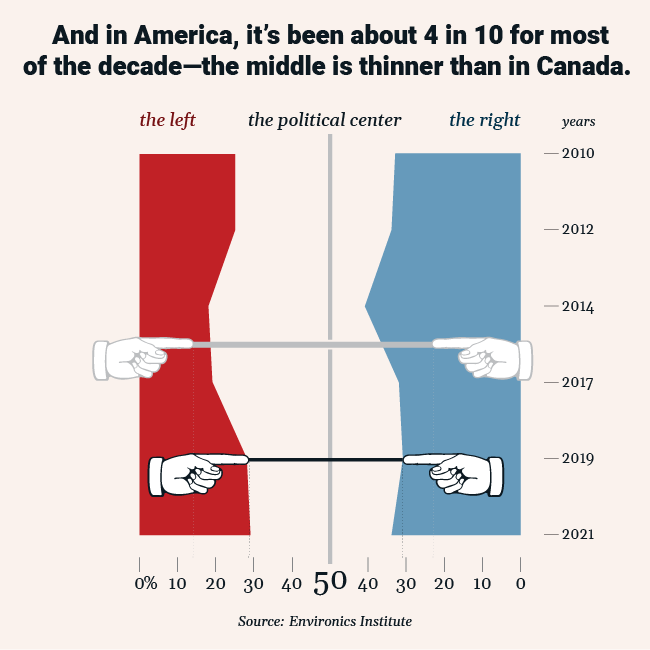
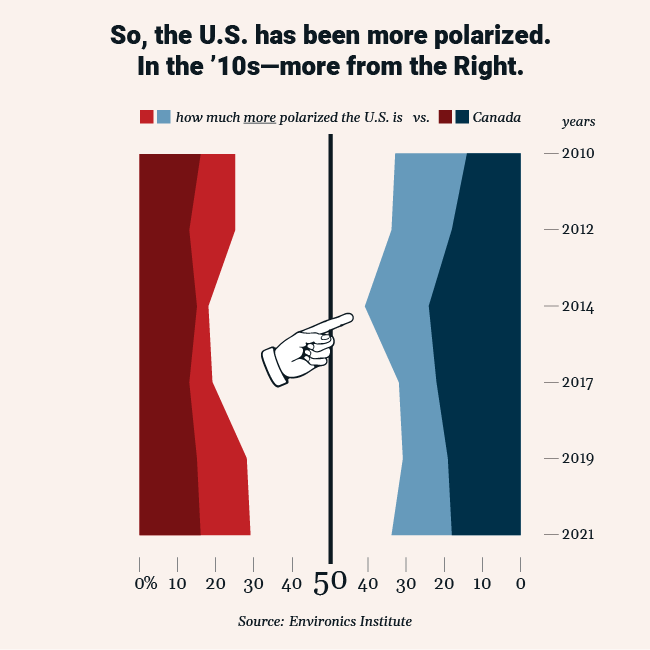
Your results are part of a bigger picture.
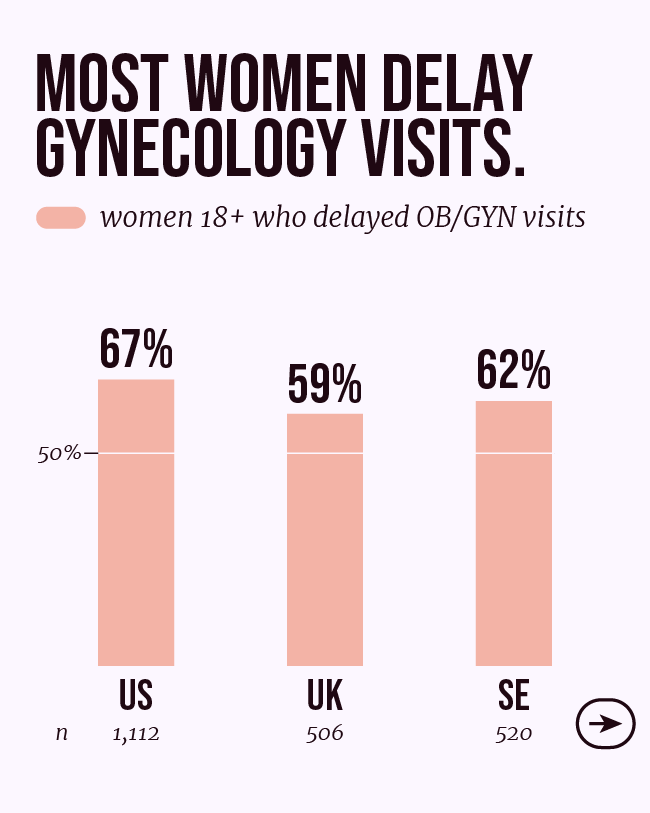
Context is important. In this carousel, some basic information on the causes of cervical cancer and data from WHO set the stage for appreciating the urgency of the survey results. The results are shown in a simple, but thoughtful visual that also communicates the base sizes—no need to forego those even in social media collateral. Symbols (ribbon) and colors (teal and white) associated with cervical cancer ground the narrative. Model wears soft materials, alluding to a warm, supportive environment.
Data source: Harris Poll




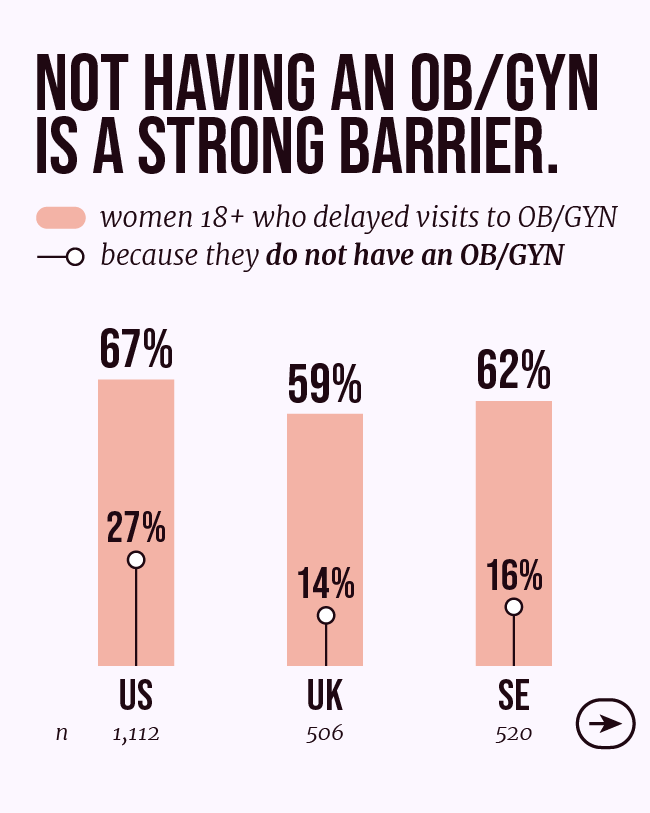
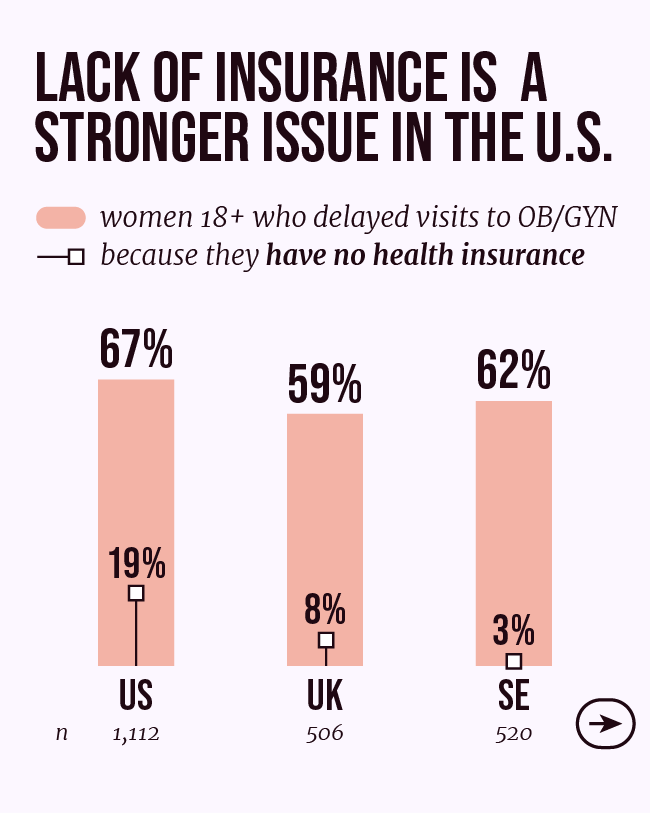
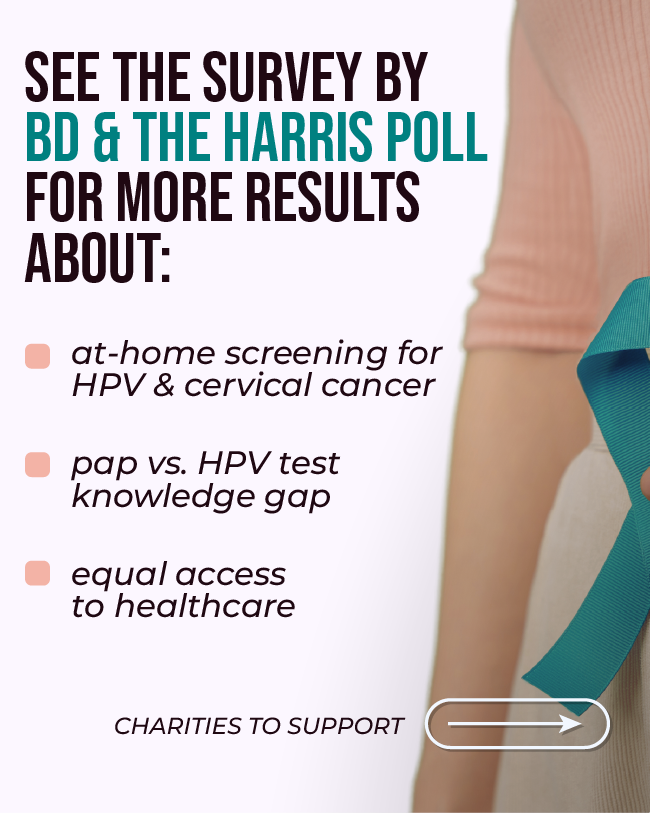

Bring in other data sources.
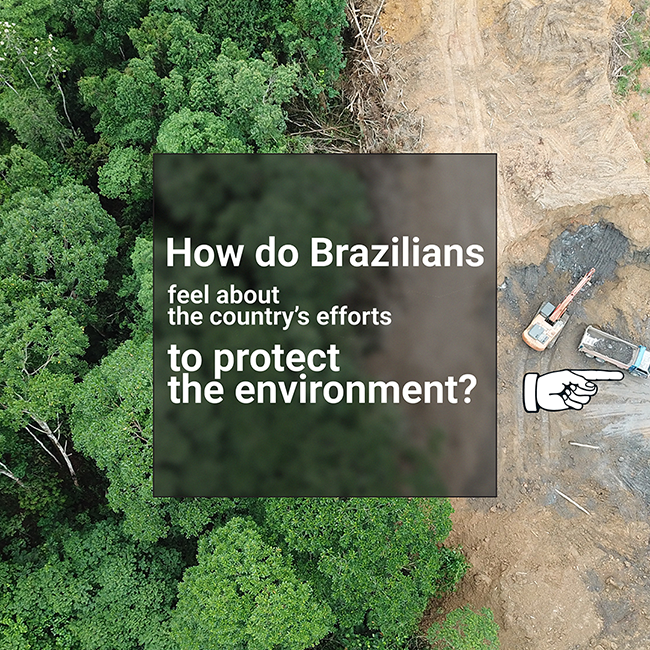
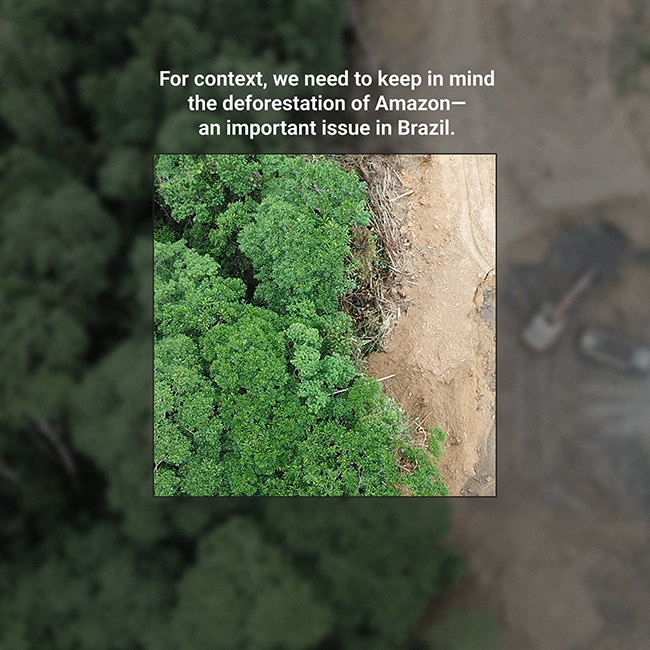
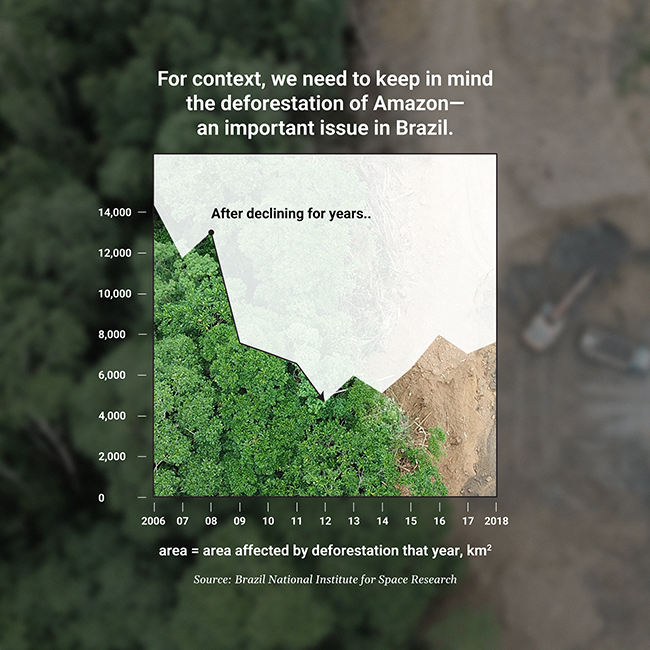
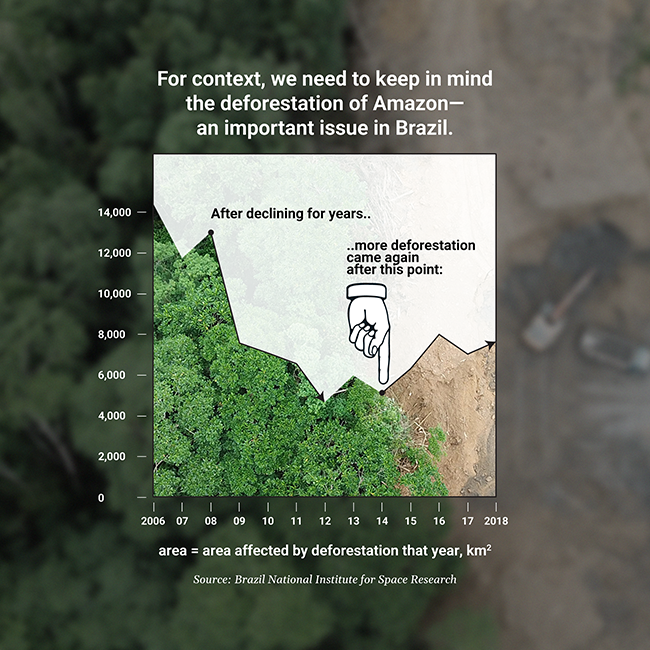
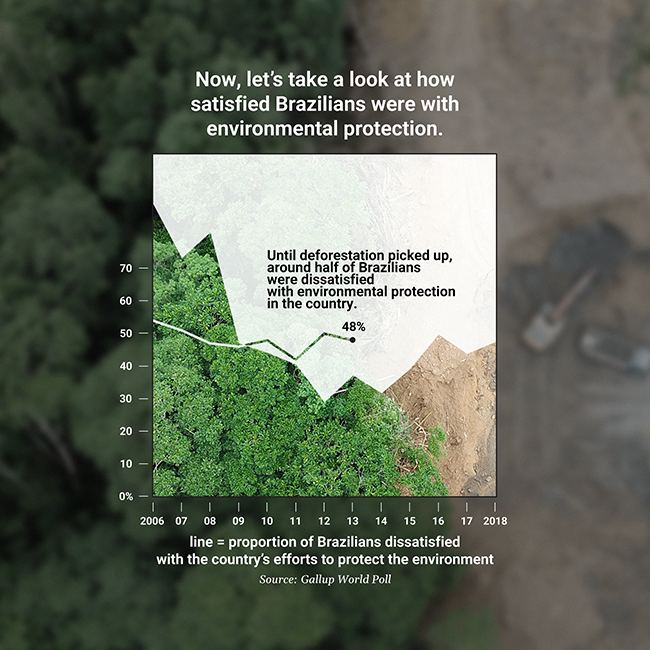
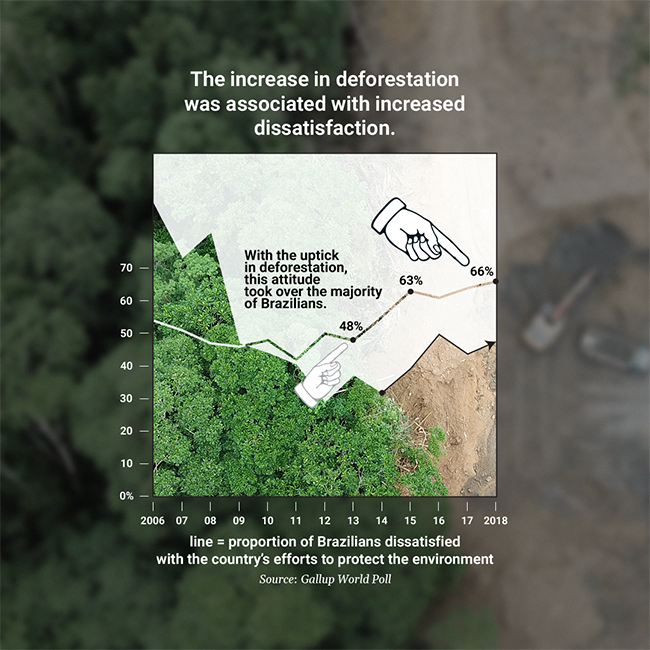
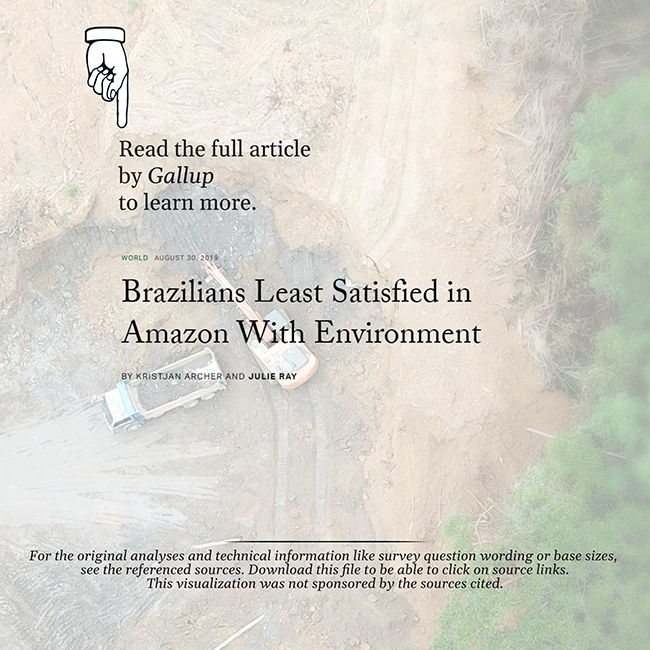
Why should market researchers limit themselves to just survey data? Designed as a mini-report, this social media post combines survey data from Gallup with deforestation data from the Brazil National Institute for Space Research. The post dives deeper into the assessment by Gallup authors that increased deforestation rates were associated with increased dissatisfaction with environmental protection. An increase in deforestation is visualized both with the trendline going up, as well as the underlying image switching from vegetation to dirt. The CTA at the end encourages the viewer to read the full article.
Data source: Instituto Nacional de Pesquisas Espaciais, Gallup
The Bespoke
approach to socials

Platform-centric
Your buyers are all on LinkedIn, and the LinkedIn algo loves carousels, as they allow for good dwell time and increased CTR thanks to back-and-forth clicking.
Rigorous
Build trust in what you have to say by including technical details of the research results.
Glossy
Thoughtfully curated assets and well-executed visuals. If it doesn’t look like it could have been in a magazine, it’s not Bespoke.
Publish something
worth clicking
again & again.
Bespoke Research Solutions Inc., 2024 | Privacy Policy