Free up
your time
to do what
matters
most
Hard deadlines, multiple projects going on at the same time, and you still need to find some time to do sales so the team has something to do next quarter... And still, we are copy-pasting (or even typing in!) data points from banners into chart templates lifted from some dusty report from five years ago?
My client was facing all that, plus field uncertainties, and having to deliver 10+ reports before the client's big concept tasting...
With a bespoke automation, my client got worry-free & accurate reporting. They were able to spend time on the good stuff: applying their unique knowledge of the client's business to find the story in the data and write up the insights.
Project background
-
Client
-A research agency
-
End client
-A global QSR chain
-
Previous research
-Several editions
-
Type of study
-Concept & pricing test
By the numbers
Concepts
Countries
reports
slides
weeks
hours
Slide & layout design
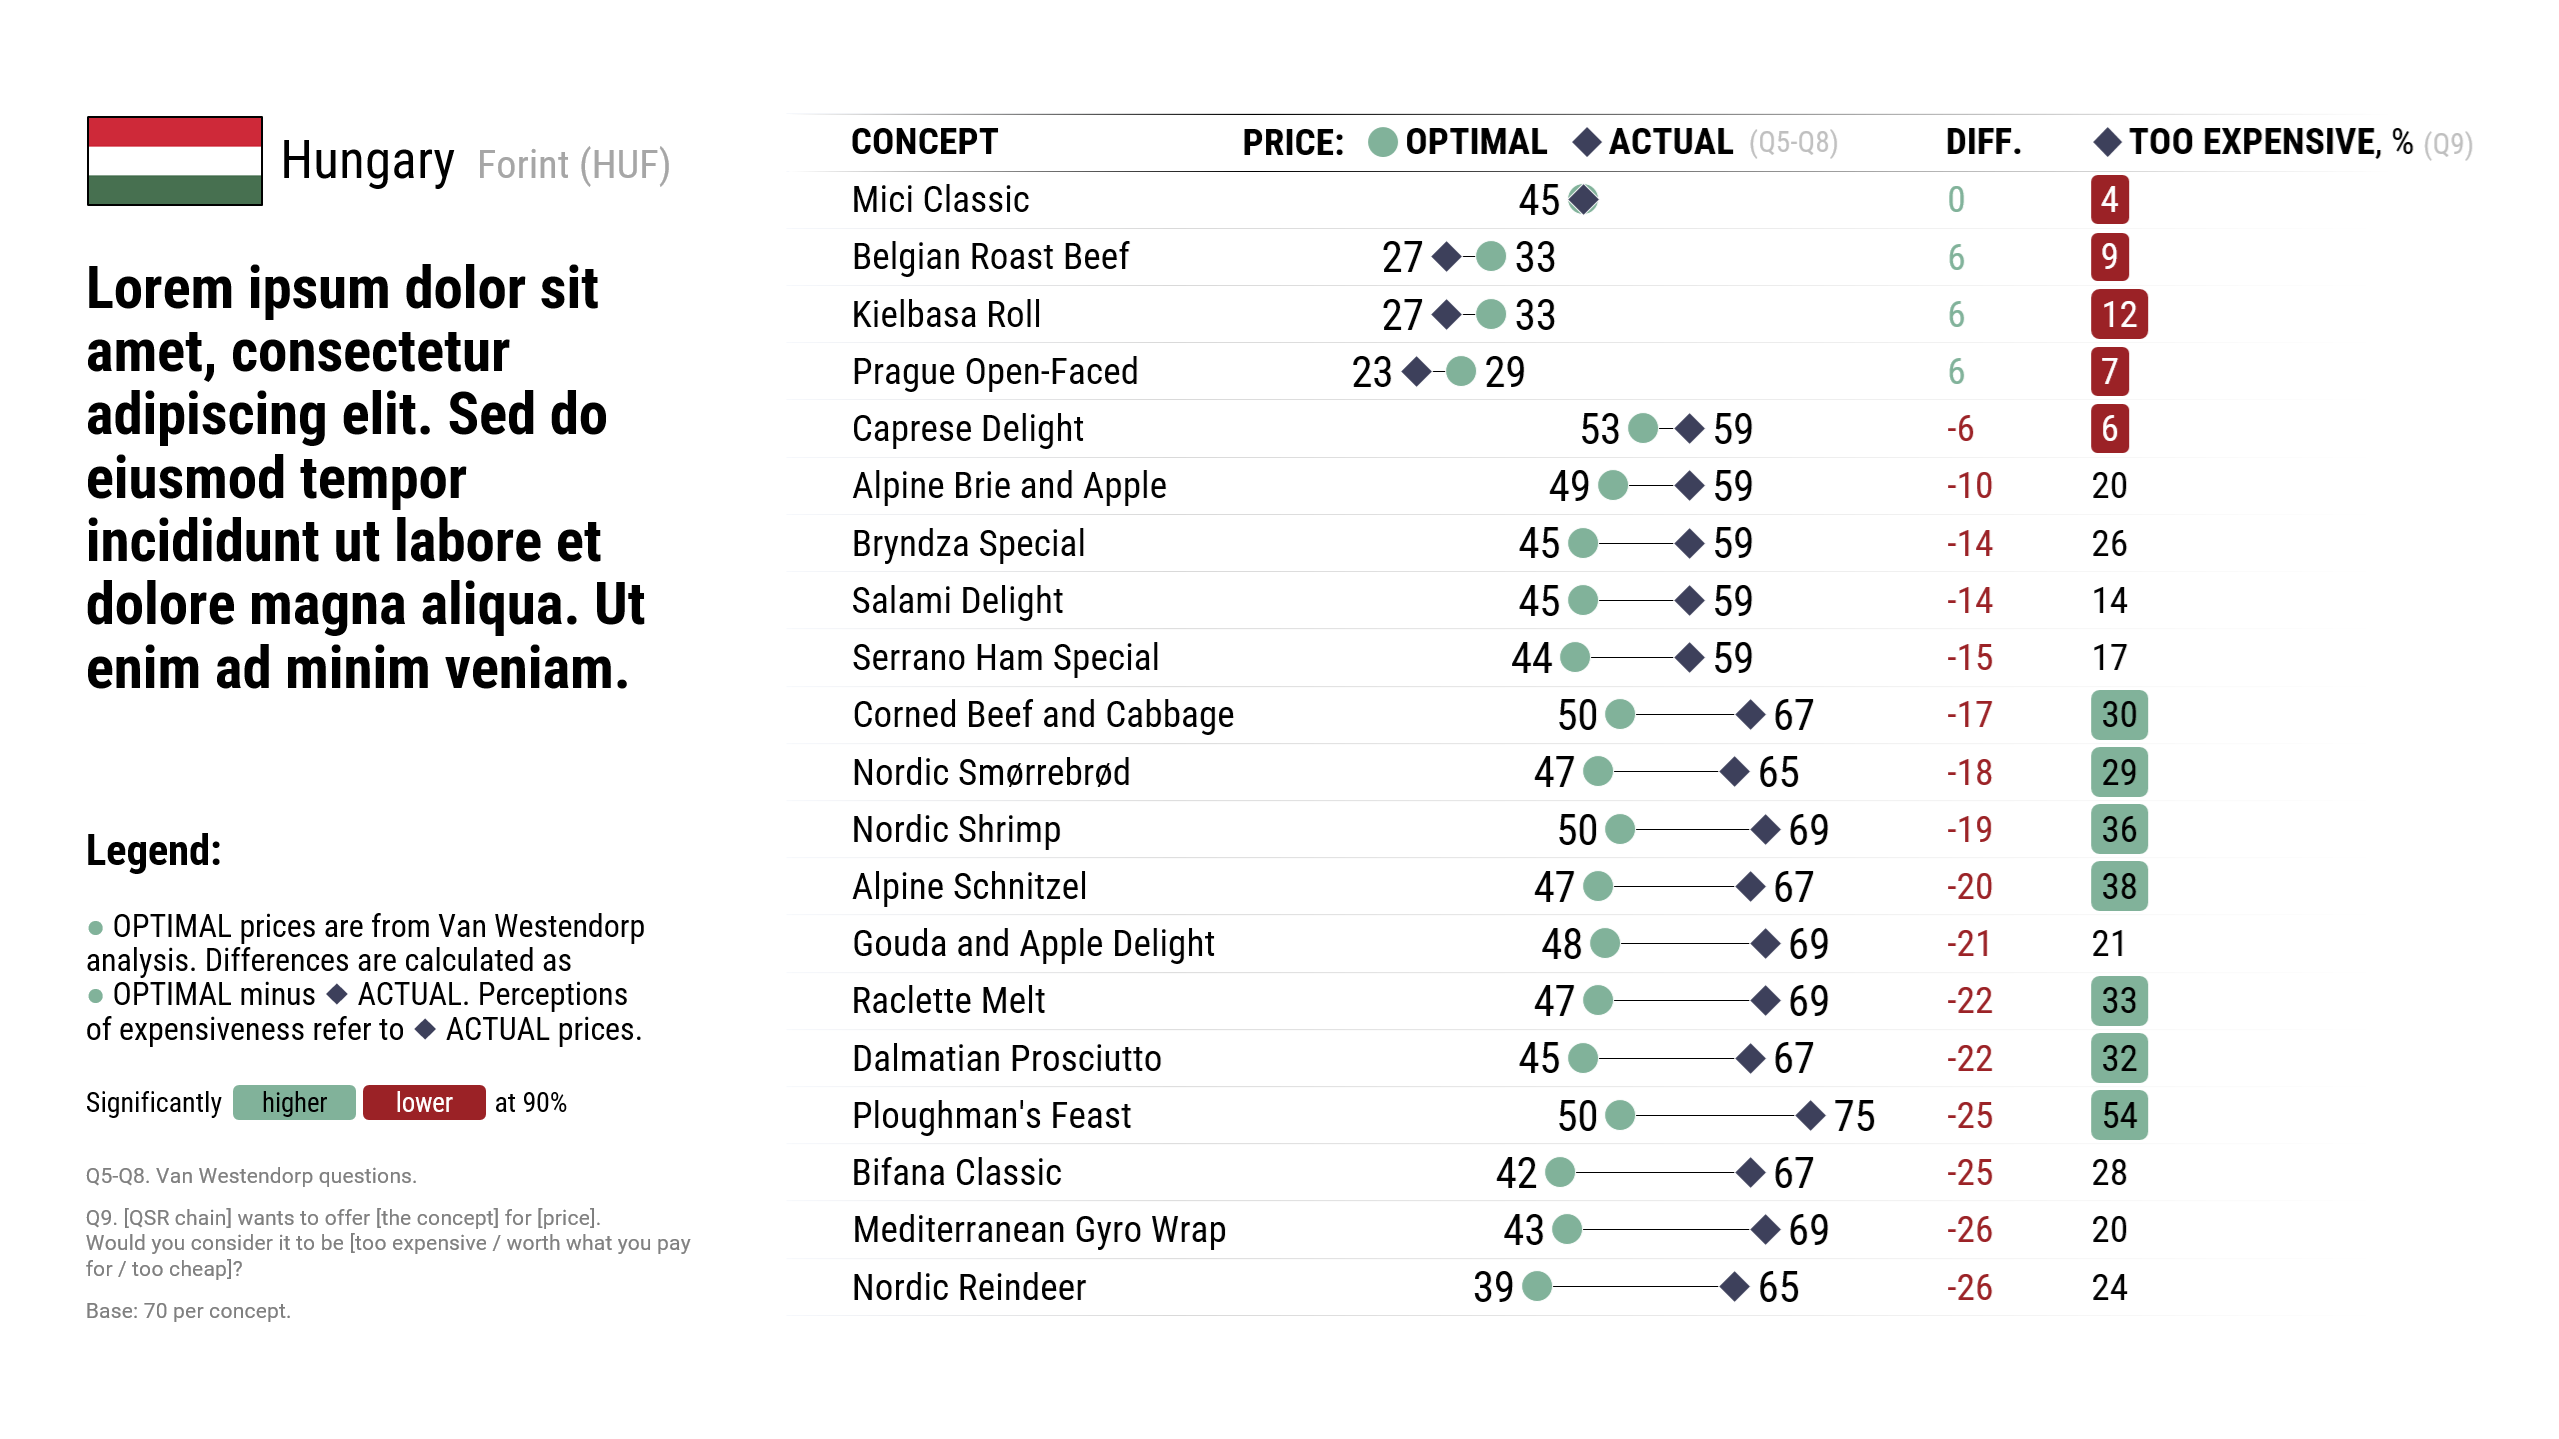
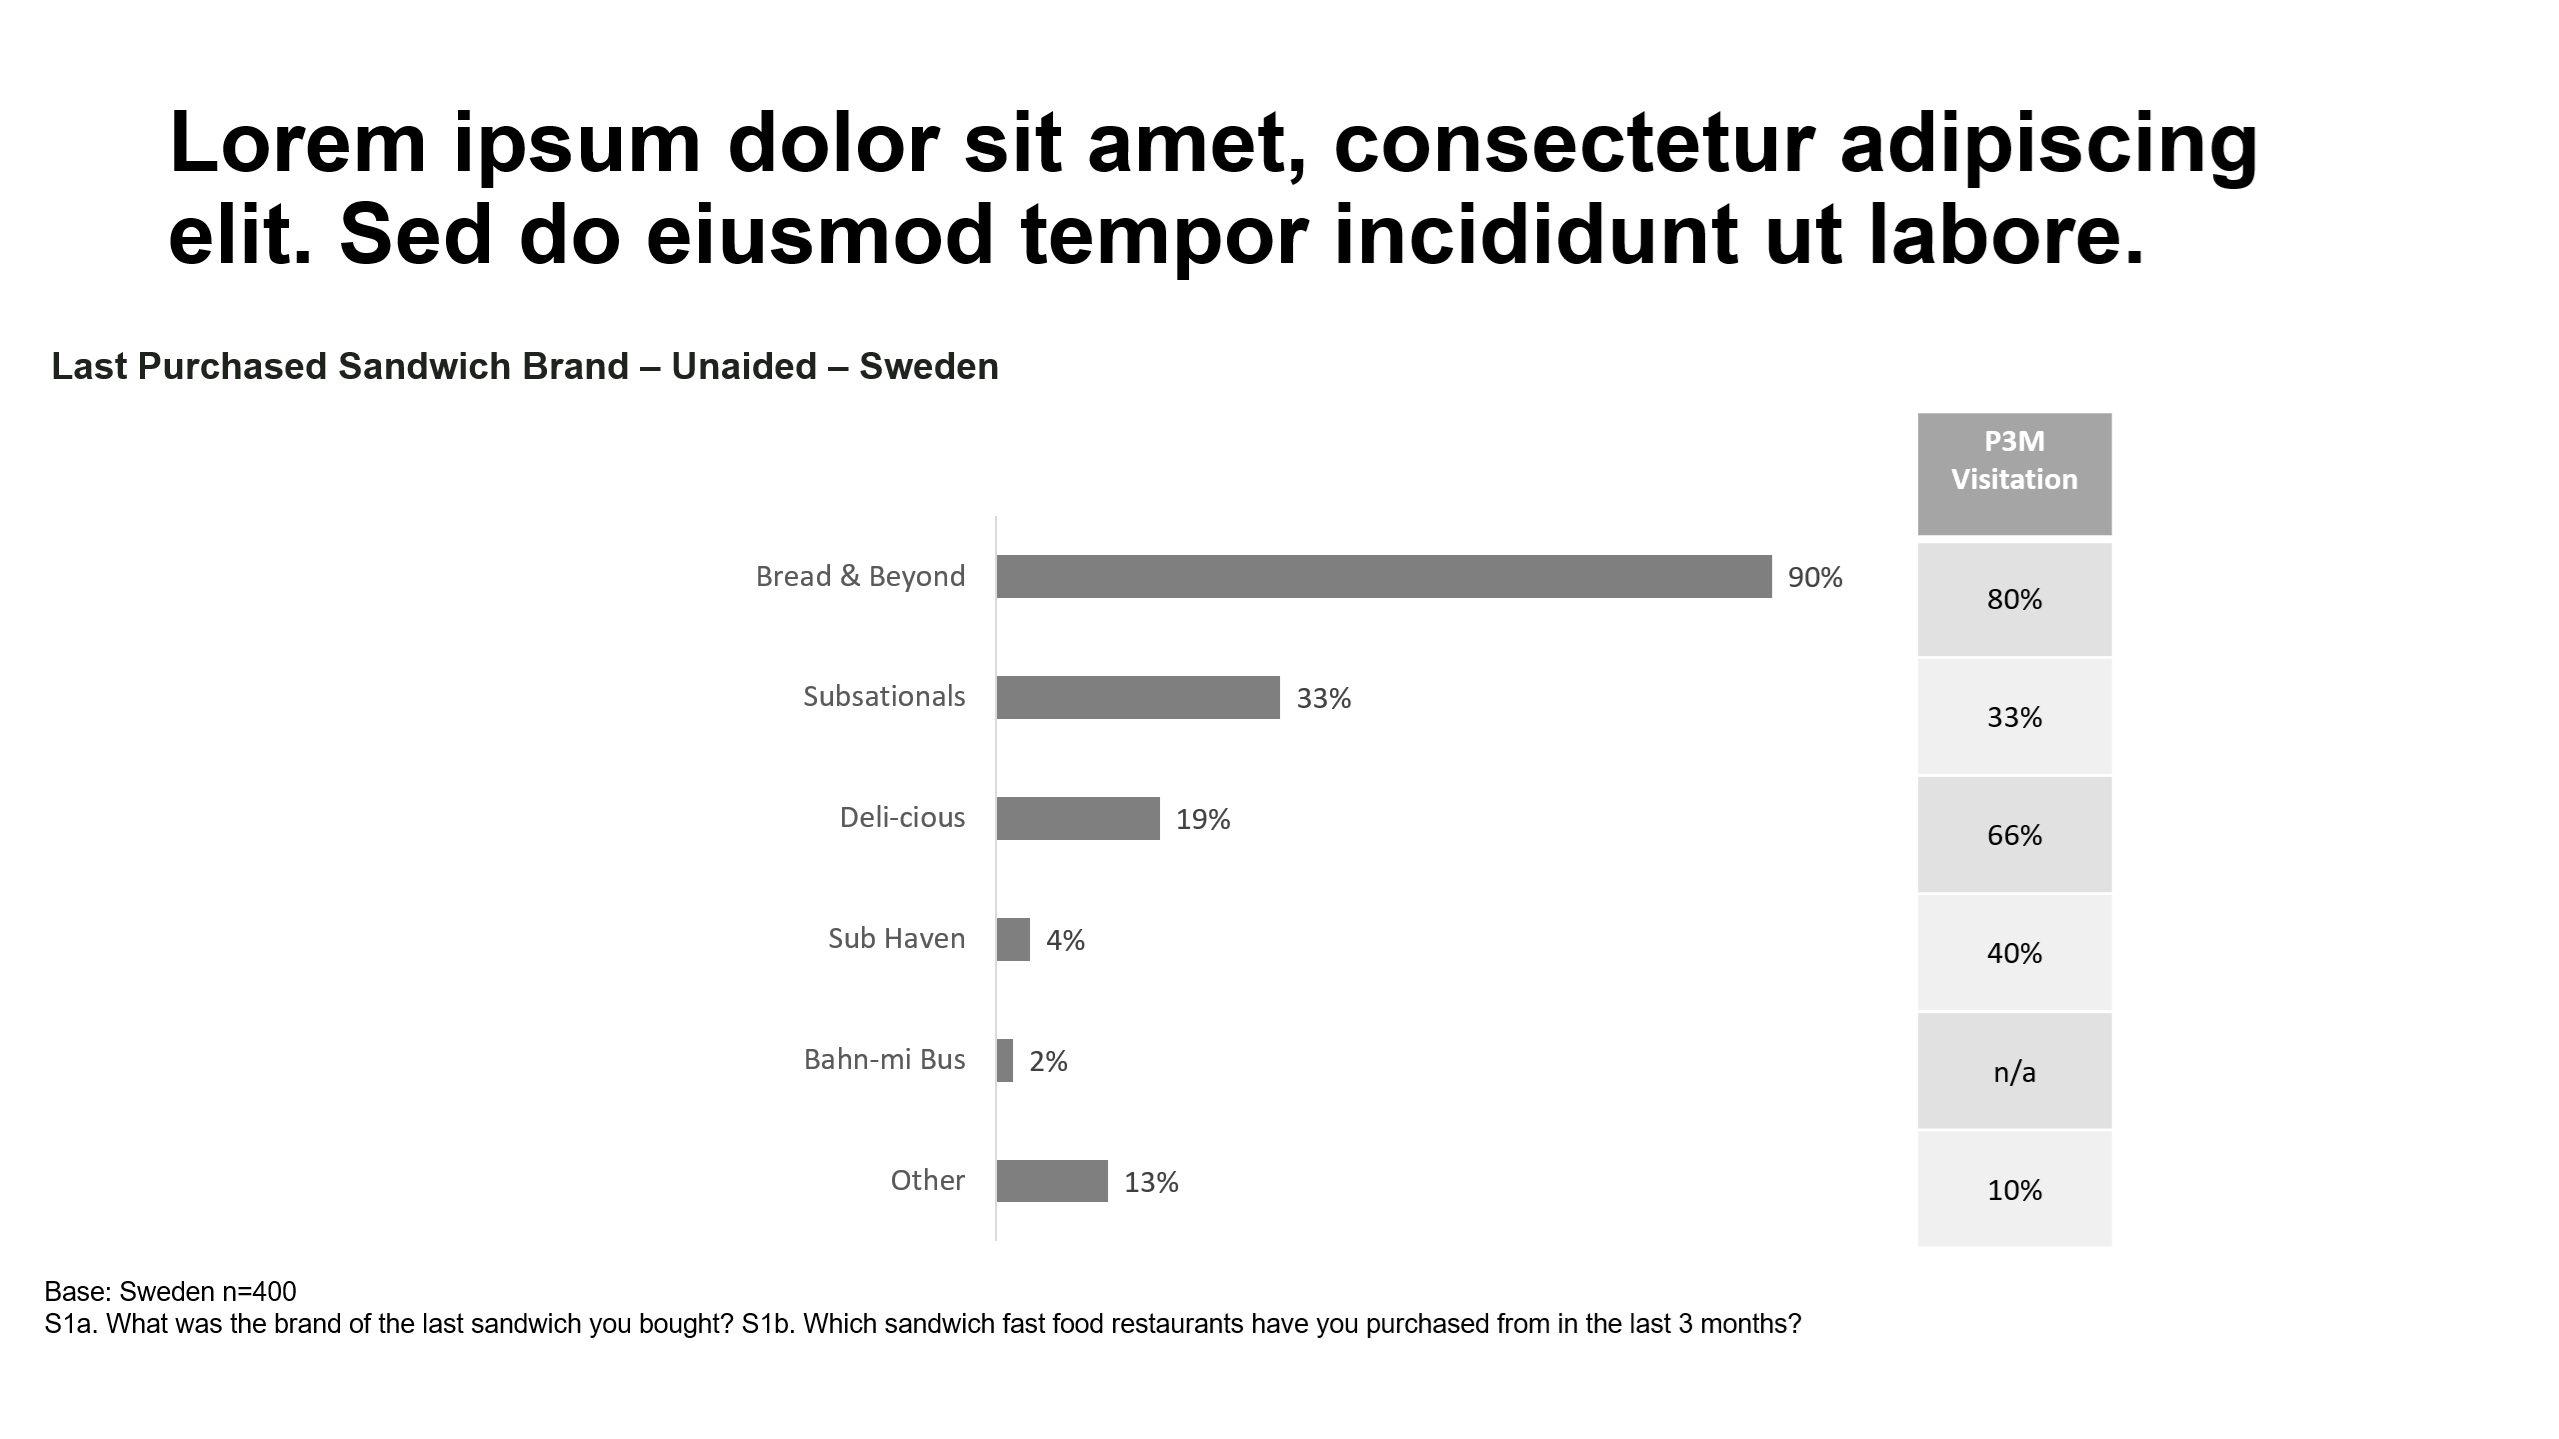
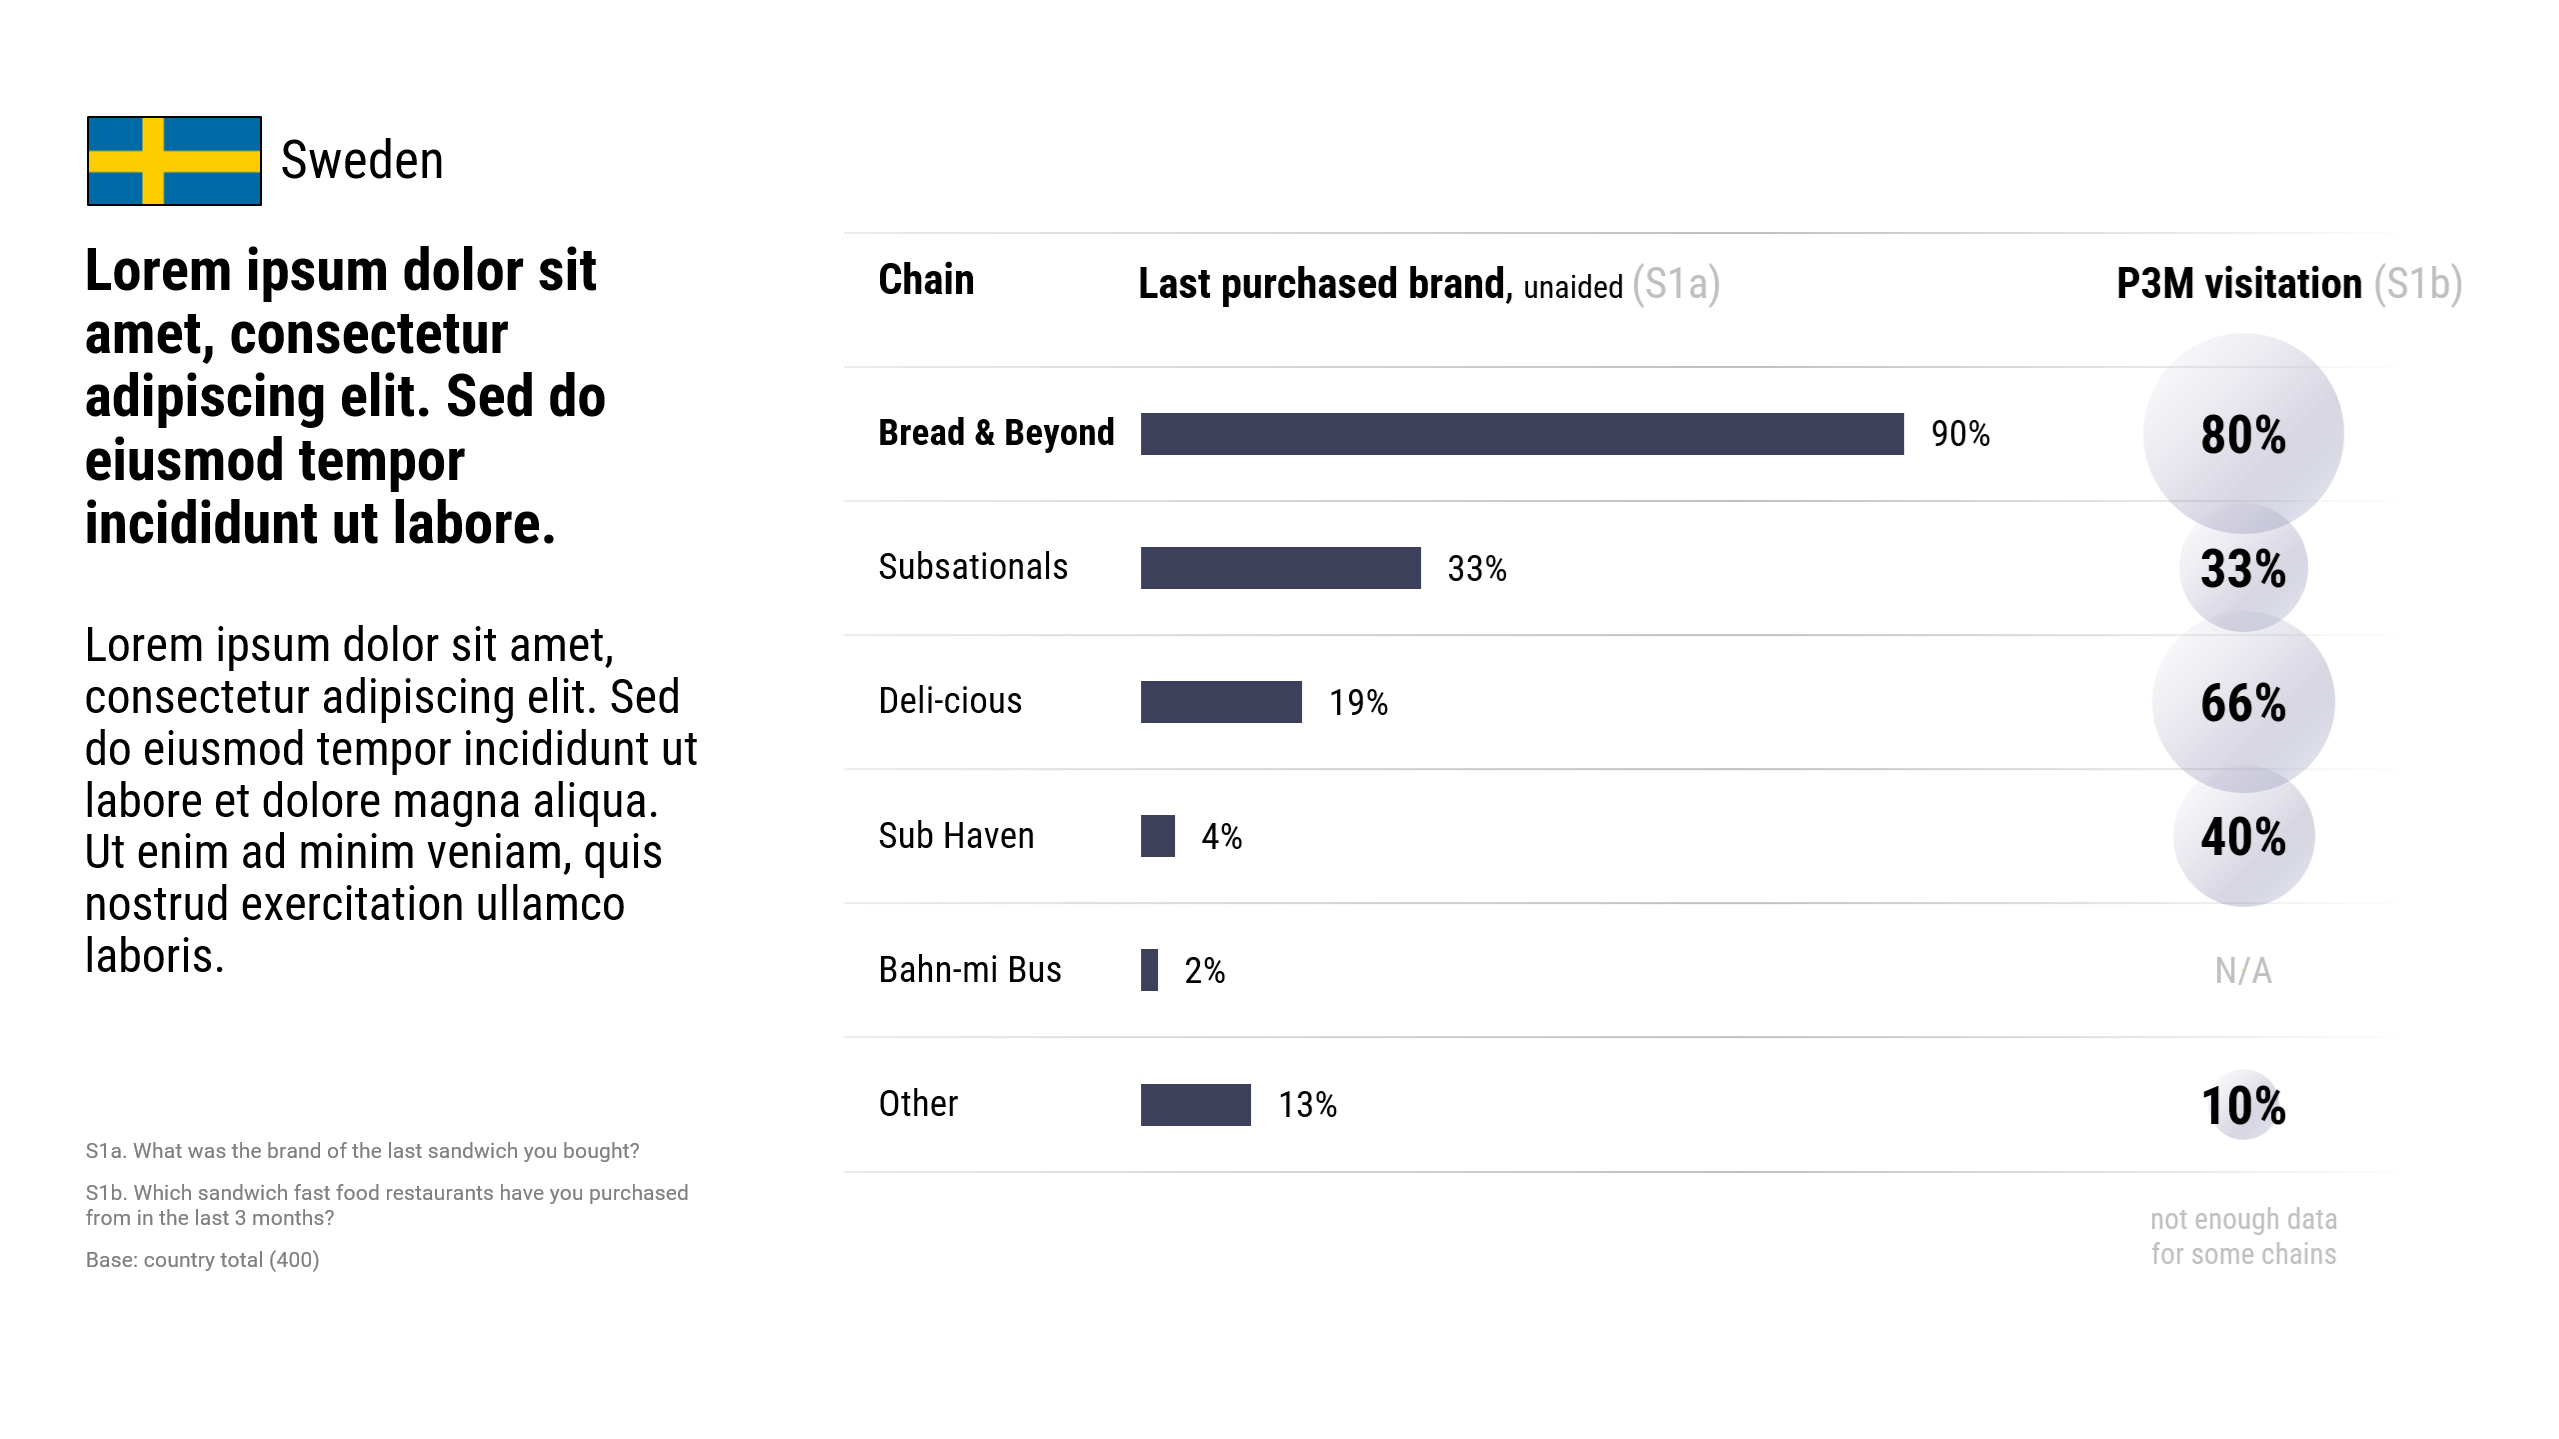
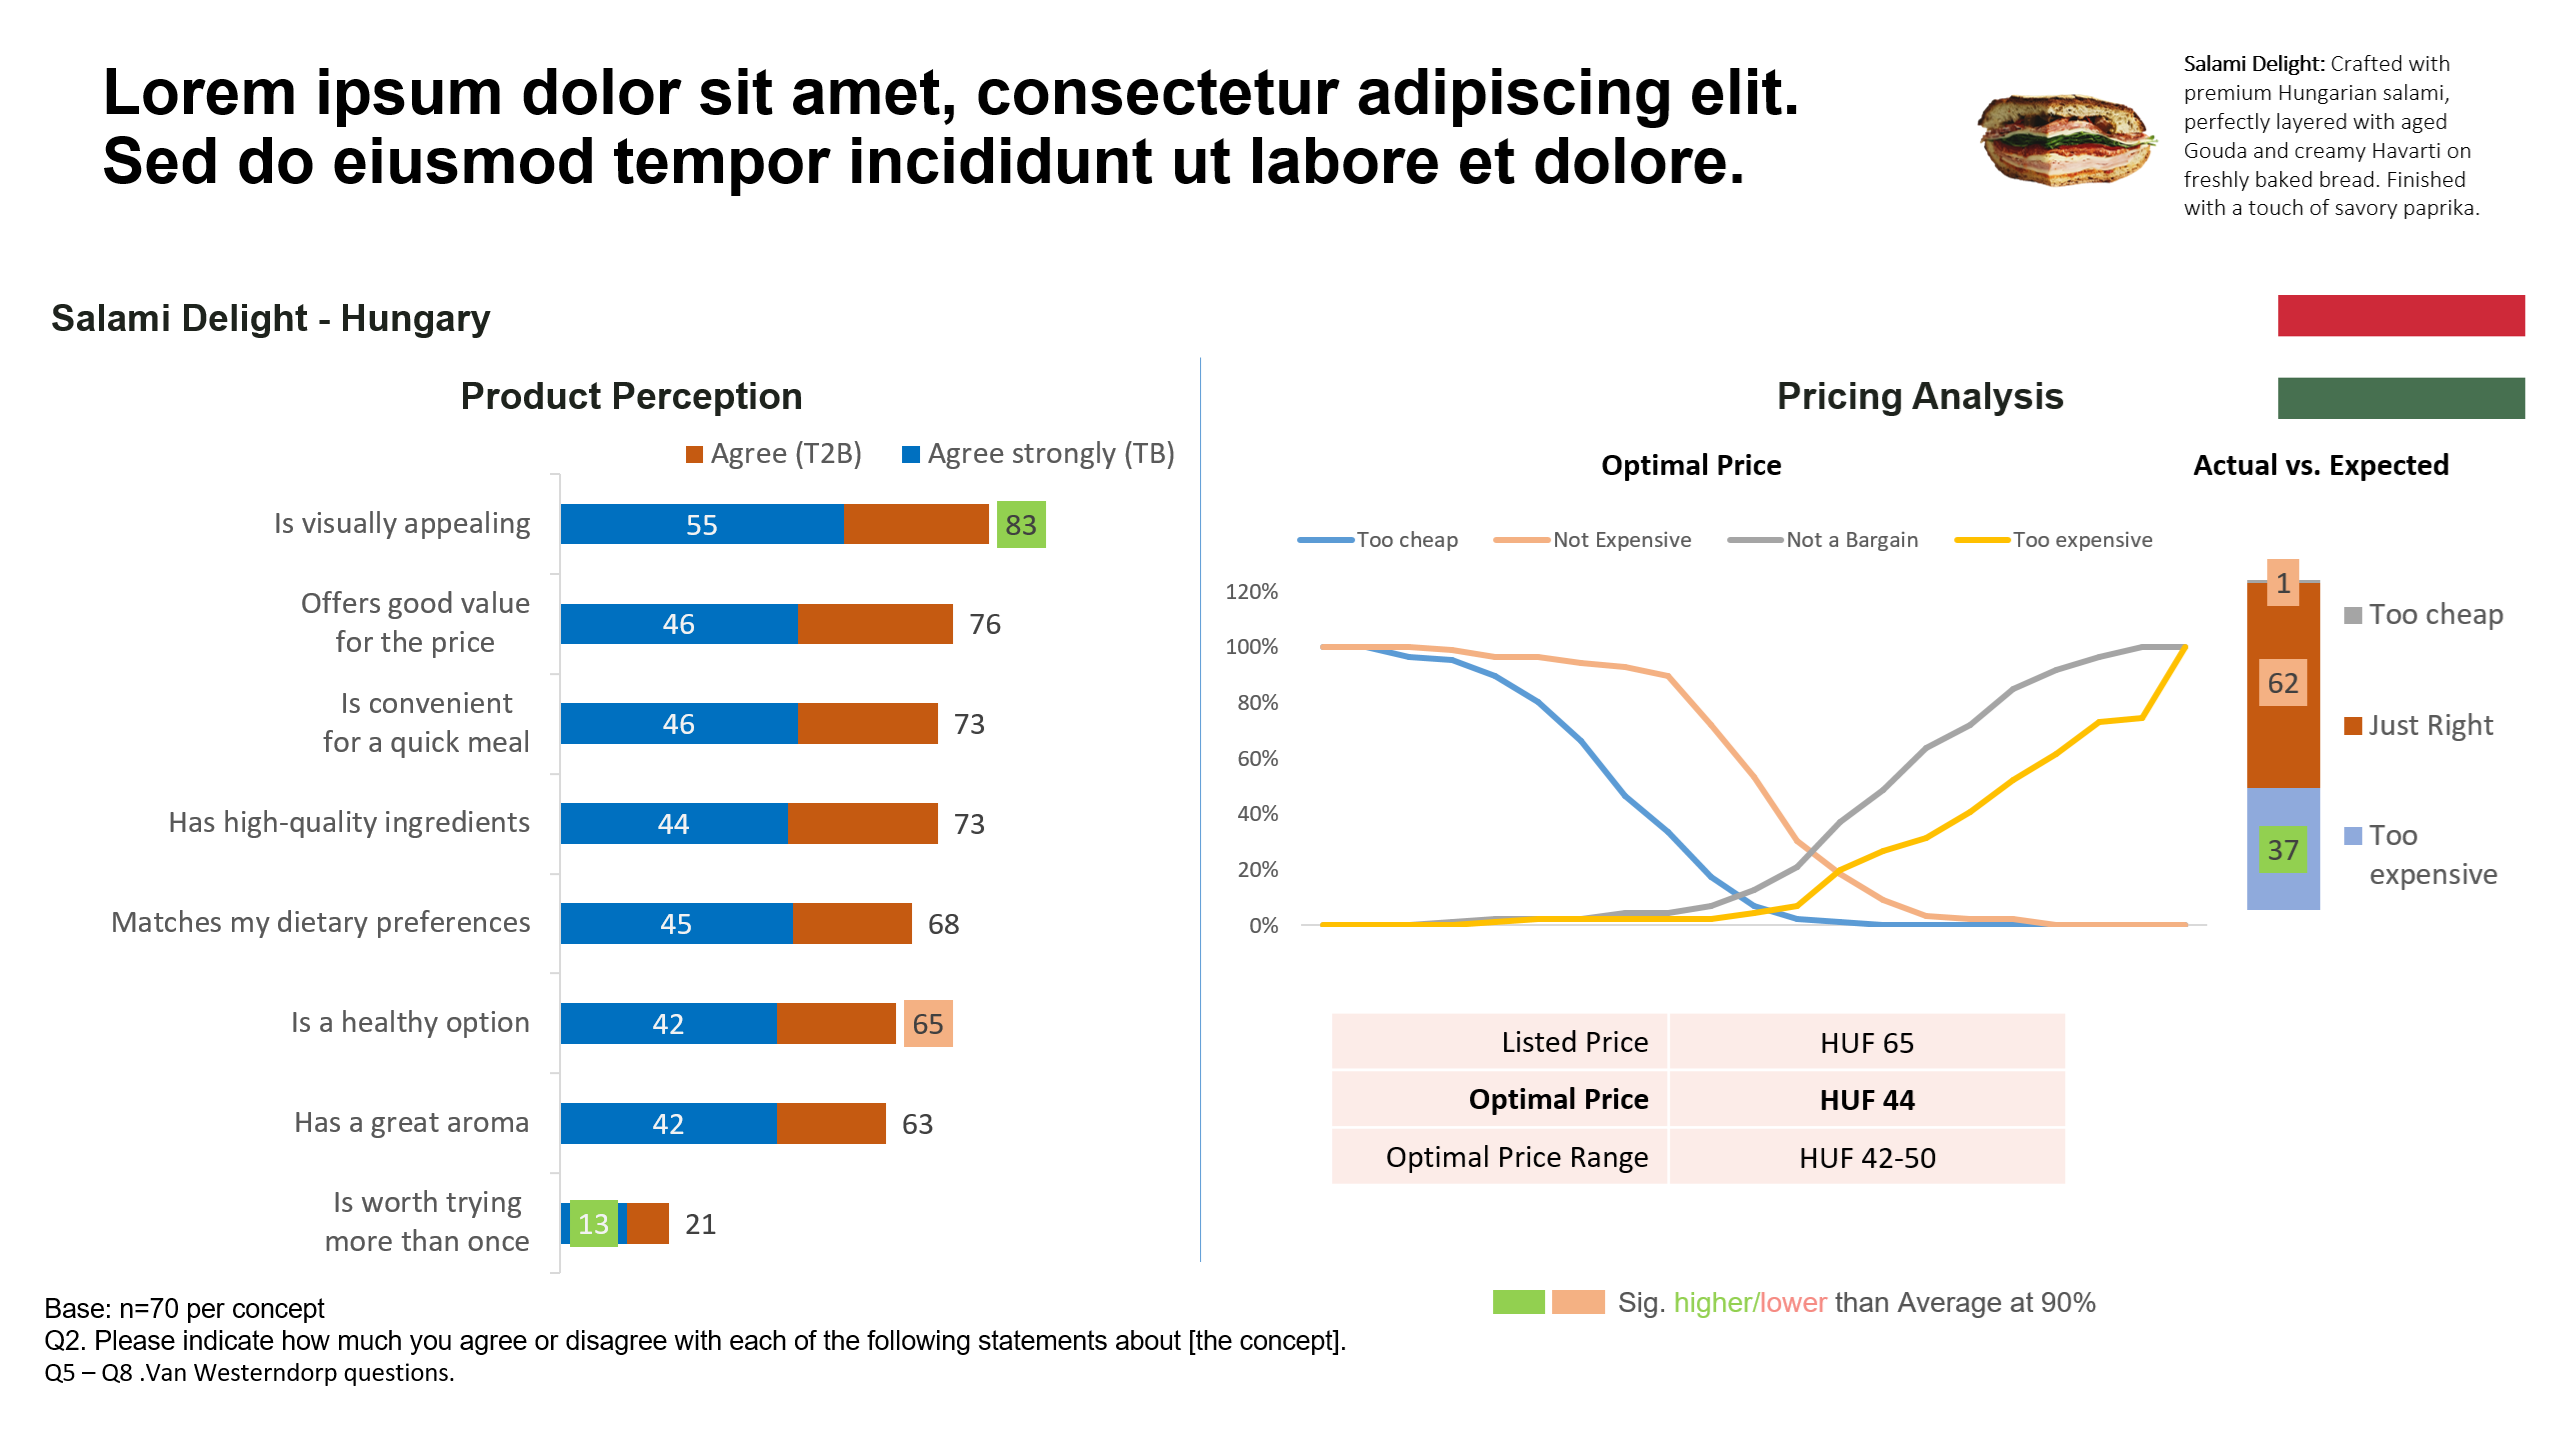
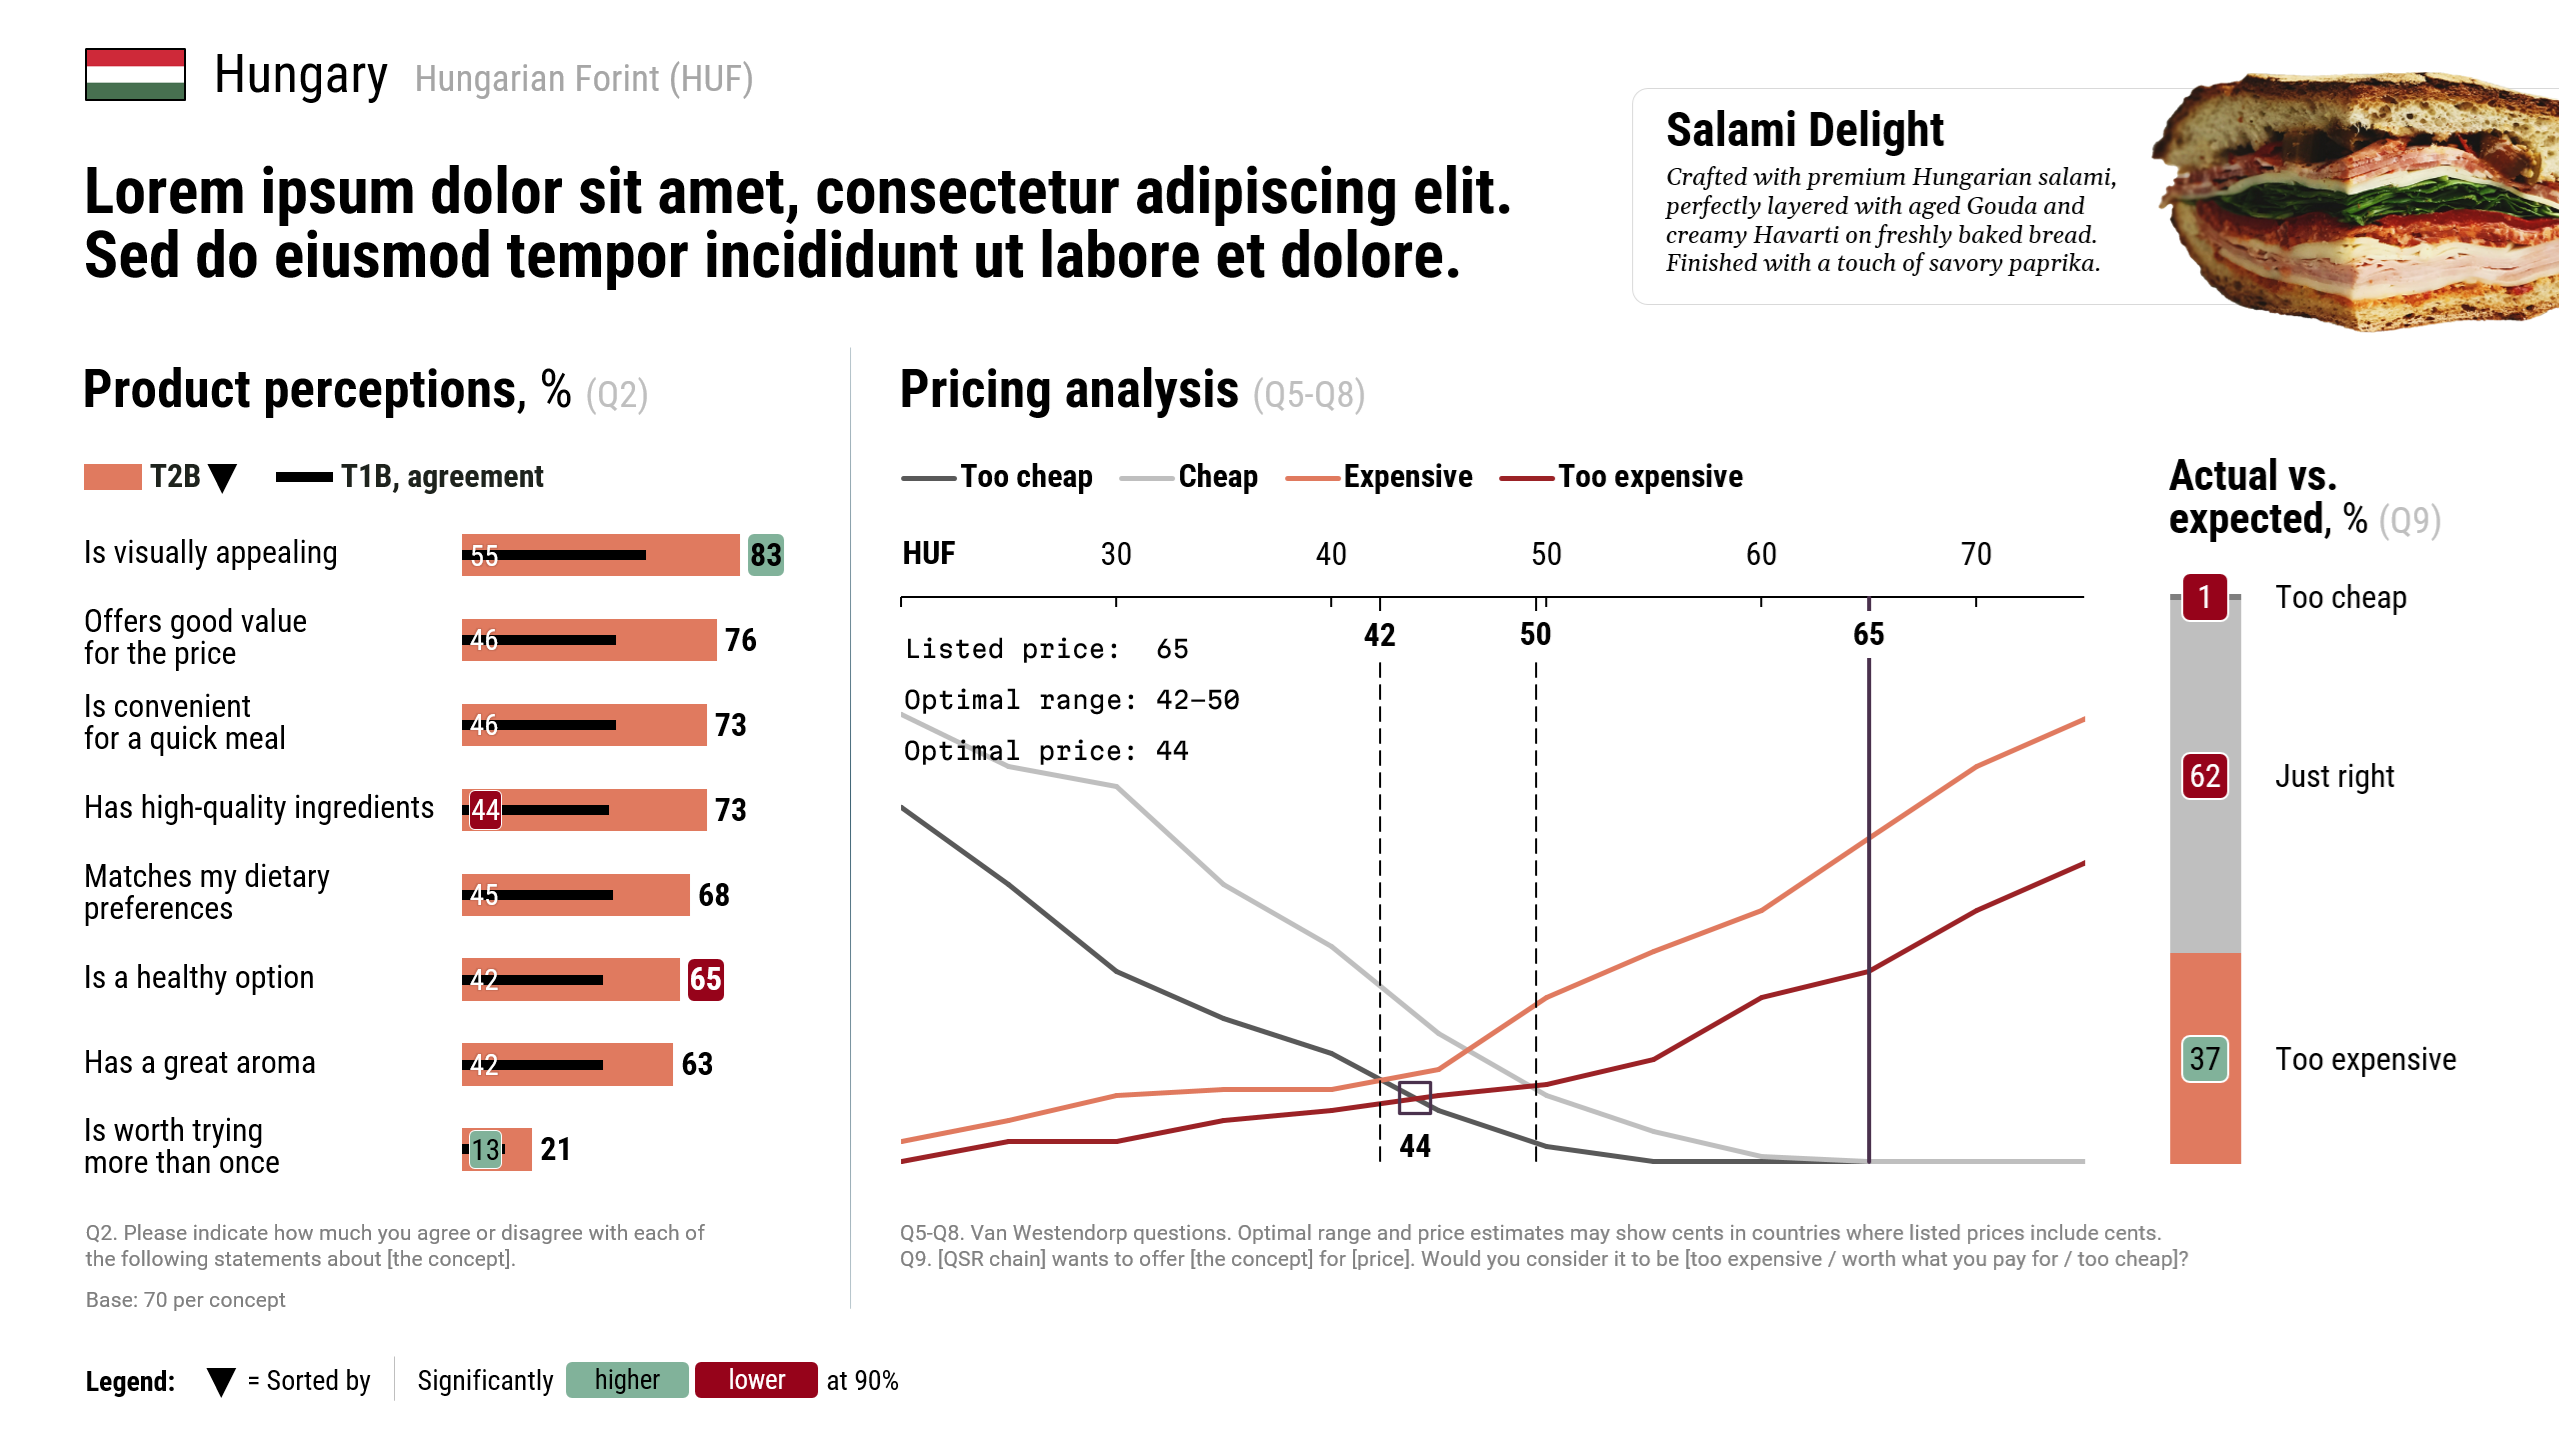
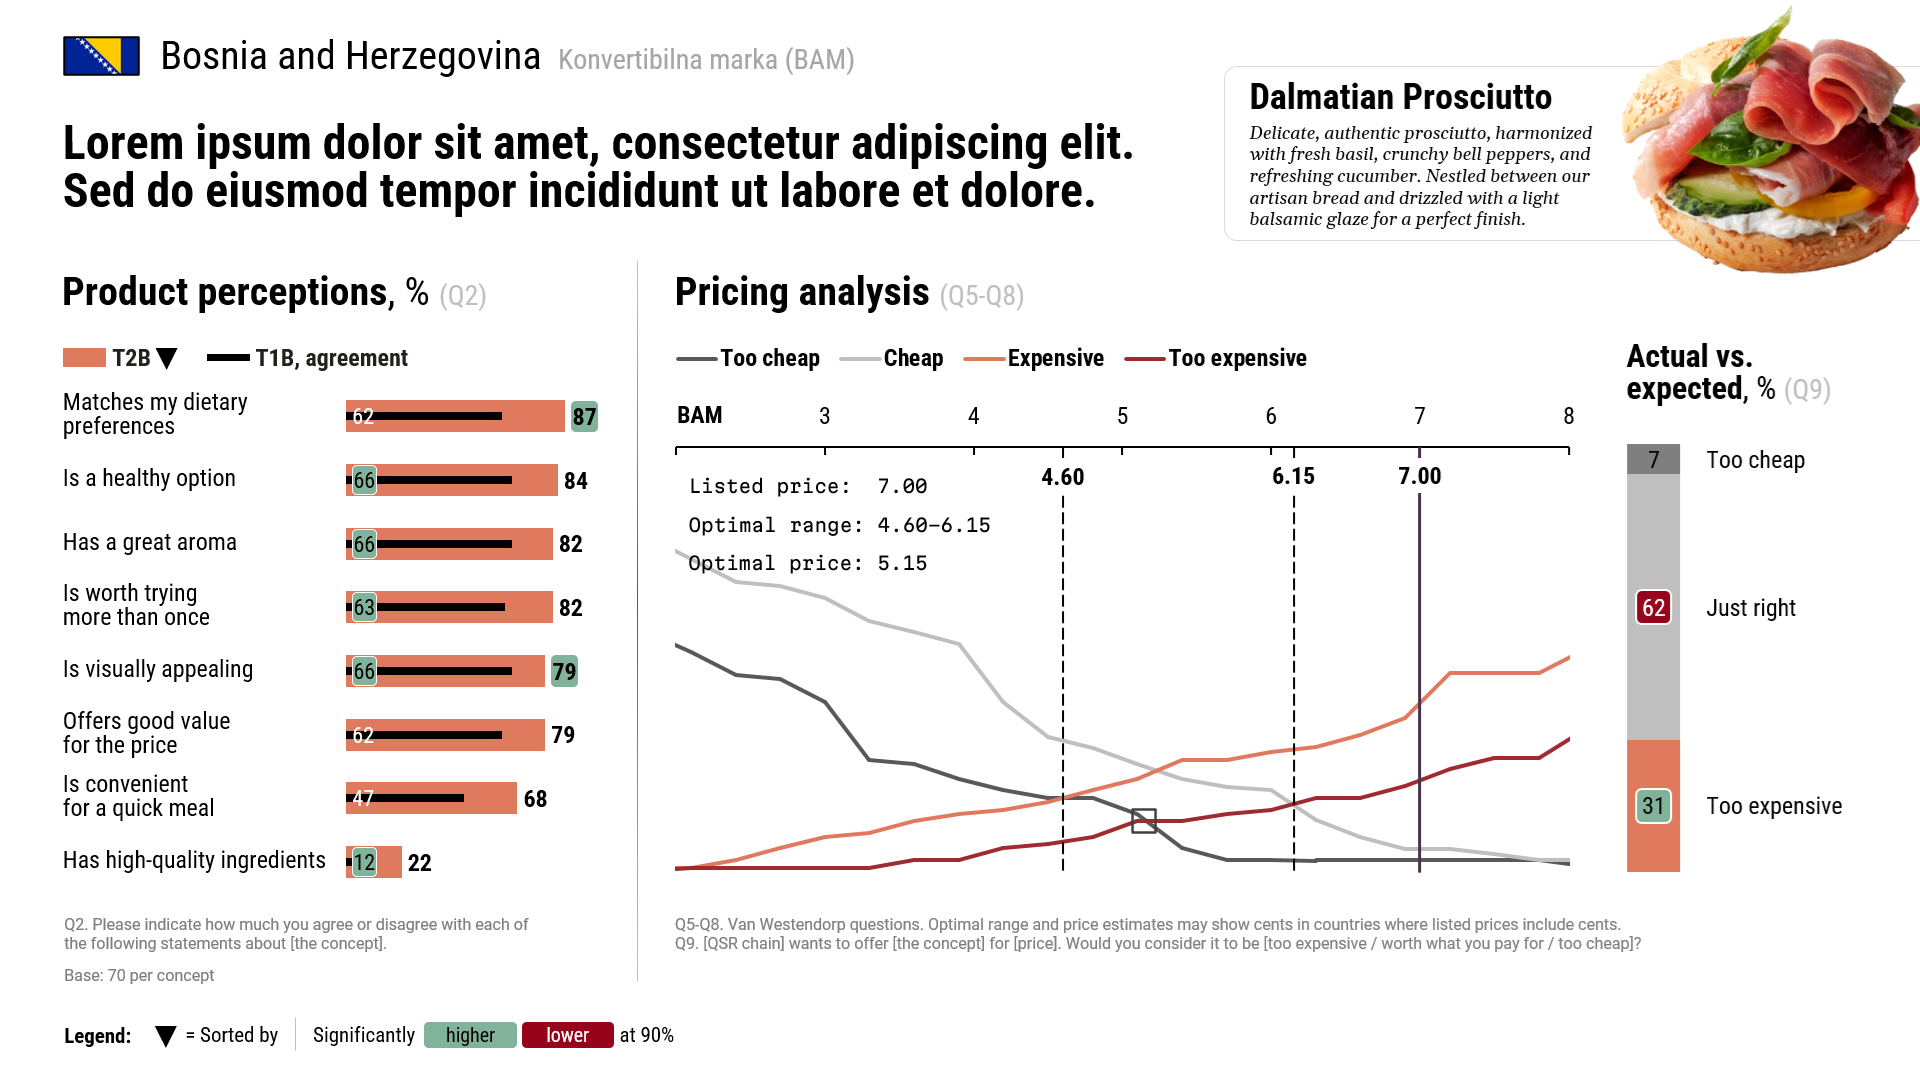
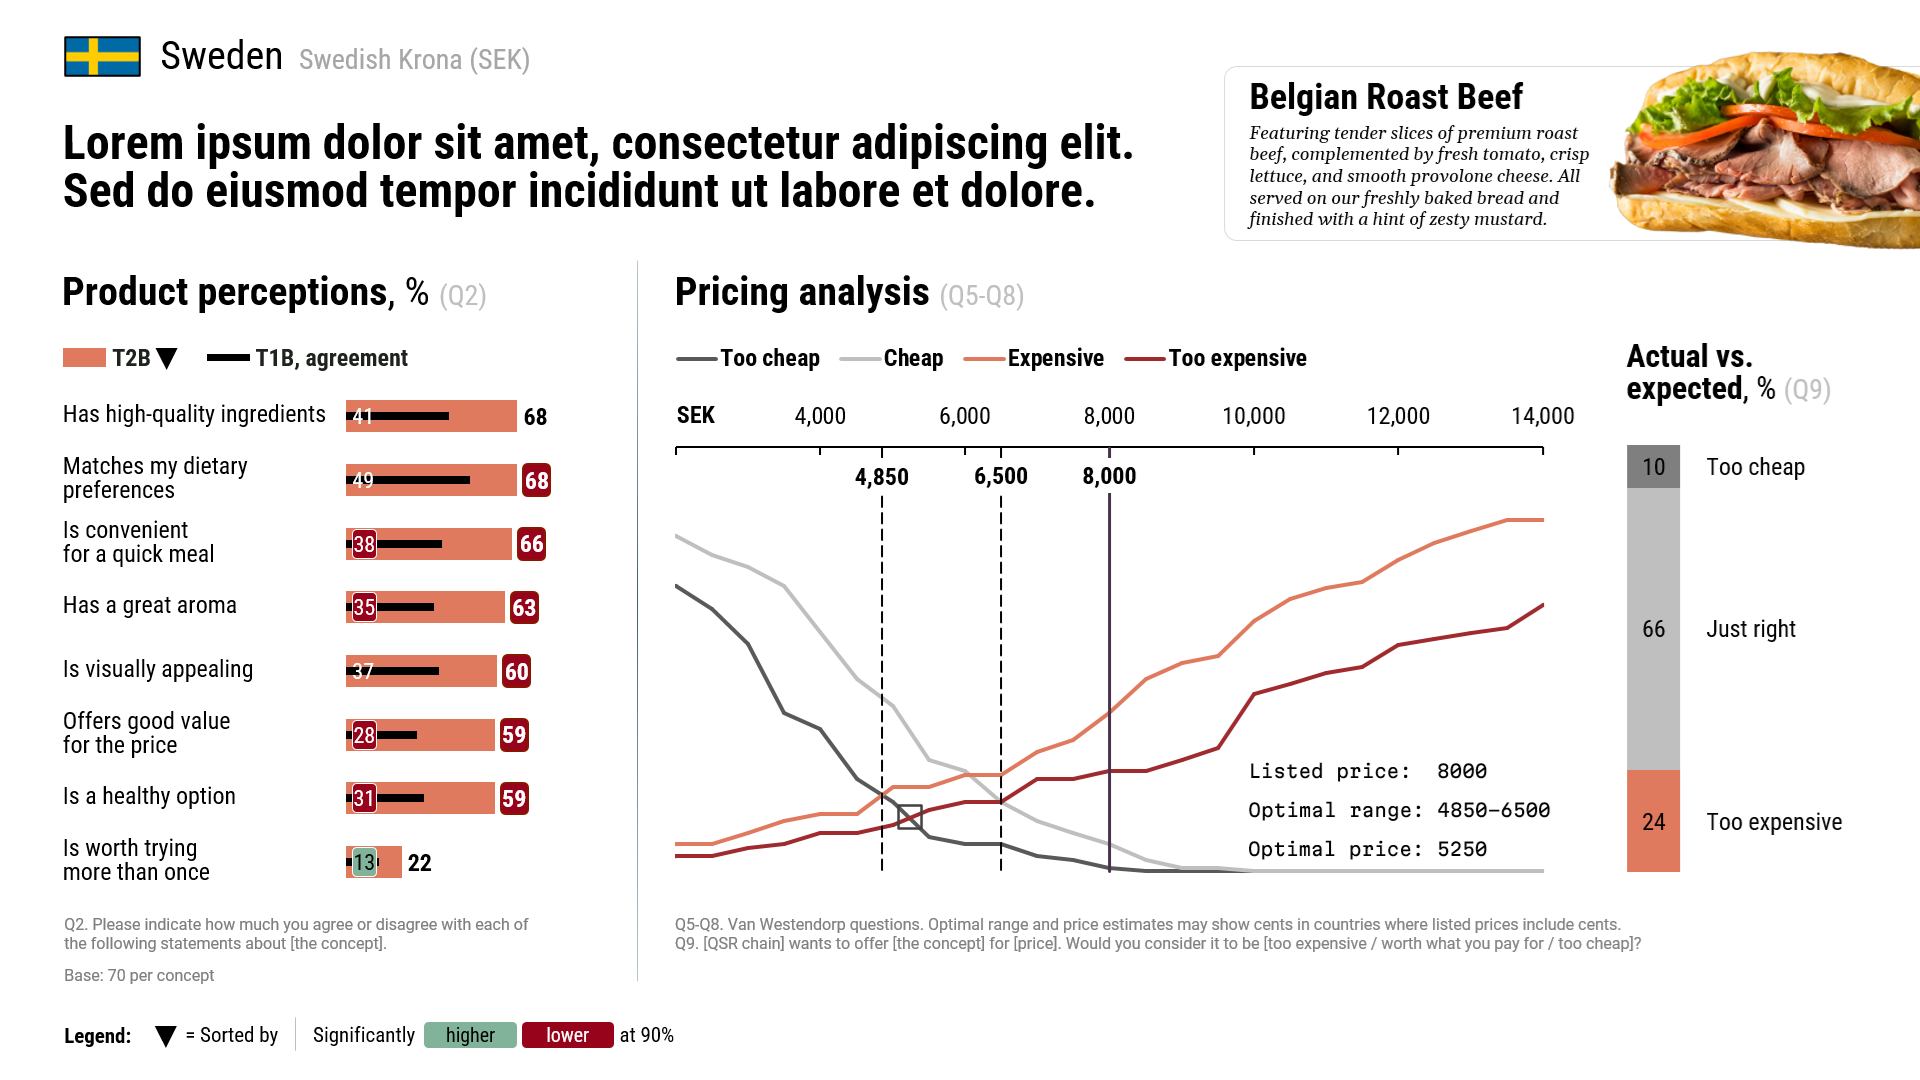
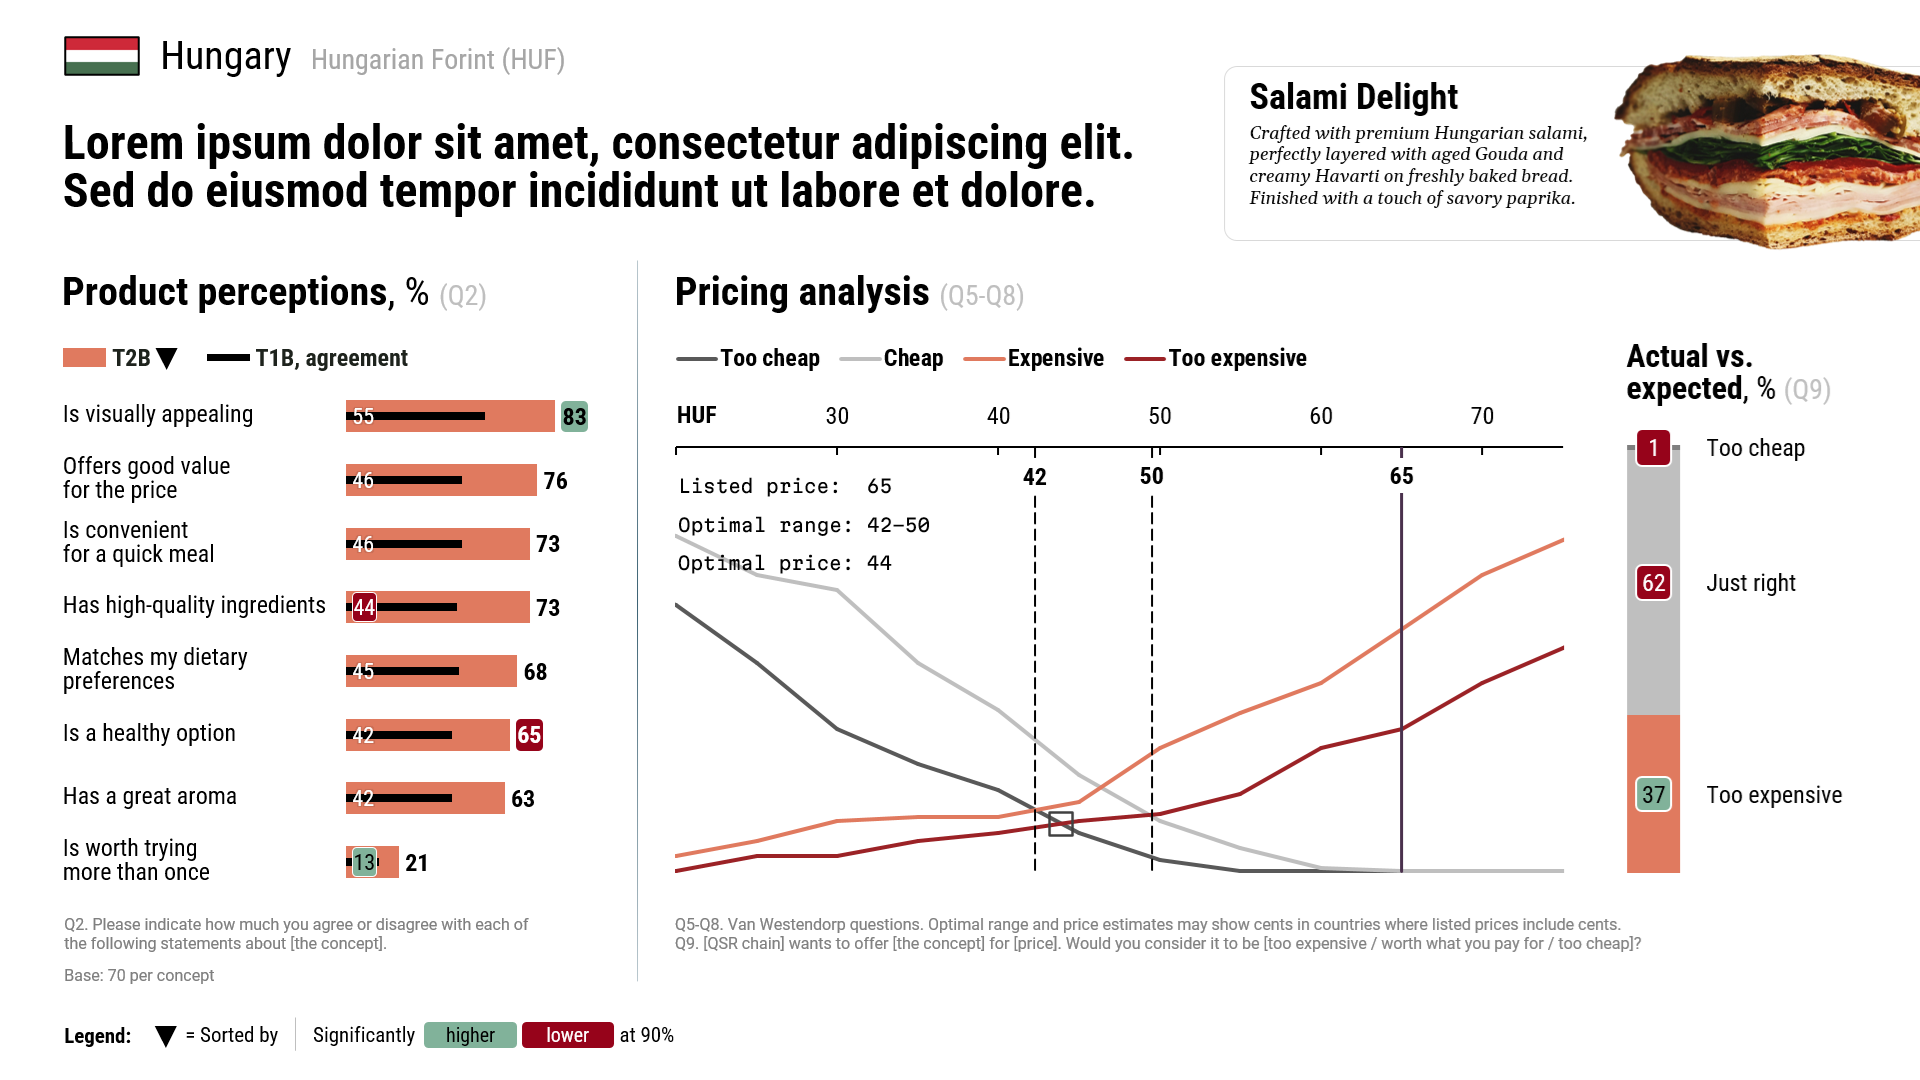
Expertly curated design & data visualization choices. Advanced custom graphs created in the familiar native PowerPoint environment. Pixel-perfect consistency within and across reports.
Examples show mock data.

Automation
Excel VBA subroutines
PowerPoint VBA subroutines
Scripts coded in Python
Meticulous custom setup to dynamically update repetitive slides efficiently, quickly, and error-free. Not just percentages and stat-testing indicators—the entry of assets, such as country indicators, product photos and descriptions, was automated as well.
Timeline
Slide & layout design
Dialing down and confirming data viz & layout choices to match the study and the target audience.
Phase 1 of development
Using the previous year's questionnaire, data, & report, devising the architecture of the automation and preparing the required workbooks, formulas, and macros.
Phase 2 of development
Updating the setup to reflect the finalized new survey and data outputs.
First report delivery
Continuously debugging & optimizing the process, this delivery sets the foundation for the rest.
Remaining reports
With same- or next-day delivery possible once new data is supplied, the client gains ample time to write analysis as well as focus on other projects.
Kick-off
Meeting to discuss project requirements.Development, phase 1
Mockup slides presented
Showing data viz & layout choices.Survey development
Over the next 2-3 weeks.